Hi All:
Here is my (incomplete) submission for challenge #6. I didn’t even get to the Status History table, but thought I’d submit what I had.
I started out on this challenge with more of an experimental sandbox mindframe, and never quite made it to a fully prepared report submission, but there were many areas I wanted to explore, which are below the “liked” notes:
What I liked:
- Using PowerPoint for all backgrounds
- Using the “Top N and Others” technique for pie and doughnut charts
- I really like pie charts and doughnut charts, as I find them very useful and easy to communicate relative size, but they can be less useful (more overwhelmed) when there are too many “slices”. I looked for and found a great technique to limit the number of slices, by only displaying slices for the Top N categories, then a single “others” slice with all those outside the Top N
- I am excited to use this technique in the future with bar charts too, as I think it will be terrifically insightful to not only see who my Top N are, but also how far they are ahead of the average of others (and conversely how far behind average my bottom N are)
- Using simple back and forward images with “bounce” for navigation
- Using familiar back and forward chevrons, reminiscent of browser buttons or the “swipe” icons in Windows Photos
What needs more attention/what I didn’t like:
- The red abstract background and theme that I chose; I had used muted blue, muted green, and white backgrounds in previous challenge submissions, and wanted to see if I could make a more garish colour and background work, so I chose a bright red abstract background. This was generally midly OK, but I the colour palette I chose didn’t provide enough differentiation, and I chose a couple of complementary colours, which (alas) didn’t work well at all, but did provide differentiation.
- I think that, after my experience, that I’m leaning towards using simpler backgrounds in my reports, for a couple of reasons:
- I end up spending too much time on colour selection
- I’m too concerned with how the visuals look within the theme rather than concentrating only on how well they display the data so useful insights can be extracted
Here’s a more detailed list of some of the techniques I used in my report:
NOTES:
Goals:
- to gain experience using PowerPoint for all backgrounds, including header, footer, and visual backgrounds
- to gain experience using image buttons
- to gain experience using the Decomposition Tree AI visual
- to gain experience with the DAX Studio and Tabular Editor external tools by using them as much as possible for measure development
Setup:
- used internet search to find a red abstract background image
- used PowerPoint to create left-to-right gradient semi-transparent rectangles in a dark complementary colour for header, footer, and body rectangles, to provide the canvas for transparent visualizations
- used filter pane to limit records shown in the report to those with Dates[Is After Today] = FALSE
- used eDNA Colour Theme Generator https://analysthub.enterprisedna.co/colour-theme-generator to extract colour hex codes from background image, then used eDNA Colour Fan to identify colours for theme
- setup navigation image buttons and images using arrow icons sourced from iconsdb.com (arrow 24, arrow 88) in #FFFFFF, #BFBFBF, #000000 for disabled, default, and on hover
General:
- used “Work” pages to try out different visuals and identify trends that were interesting and should be included in the main report pages
- formatted all measures and calculated columns using eDNA DAX Clean Up tool https://analysthub.enterprisedna.co/dax-clean-up
- made extensive use of the [General] section in the [Visualizations] pane to ensure consistent sizing of all visual elements and adjusted the X/X/Width/Height as necessary (I made everything multiples of 10 pixels [where possible] to help me keep things aligned)
Data Model:
- used eDNA extended date table as [Dates] Extended Date Table (Power Query M function)
- used eDNA period table as [Periods]; adjusted for two periods: Last 2 Years, and Previous Dynamic Date Range Slicer- Query M
- marked [Dates] table as a date table
- changed all date formats to dd-mmm-yyyy [by typing “dd-mmm-yyyy” into “Format” box directly]
- updated [Dates] table to use the fxStartDate and fxEndDate values (see below)
- added all “*_Tbl” tables from Excel file;
- renamed fields as necessary (e.g., in [Types] changed [ID] to [Type ID], changed [Description] to [Type] to avoid future confusion)
- changed case of “lookup” table columns as necessary to be consistent (used “Transform\Format\Capitalize Each Word”)
- corrected reverse naming of Customer[First Name] and Customer[Last Name] columns; created merged column for full name (Customer[Customer])
- renamed [Regions] table to [Locations]; renamed [Region ID] fields in [Locations] and [Customers] tables to [Location ID]
- deleted all auto-generated relationships
- arranged table model in a “waterfall” and used “Manage Relationships” dialog to add all relationships (all 1-to-many)
- created empty tables for [Key Measures] and [Admin Measures]; opened 2 sessions of Tabular Editor (1 each on my Challenge #5 PBIX and this file) and copied measures
- added [Last Refresh] table
- hid all ID fields
- added disconnected supporting tables for [Categories plus Others] and [States plus Others]; accepted default of many-to-many relationship offered by Power BI when linking to [Categories] and [States] tables
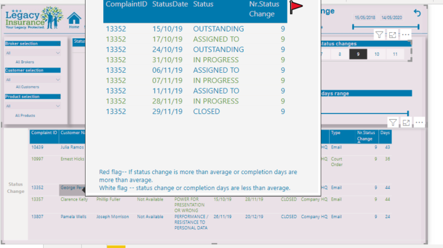
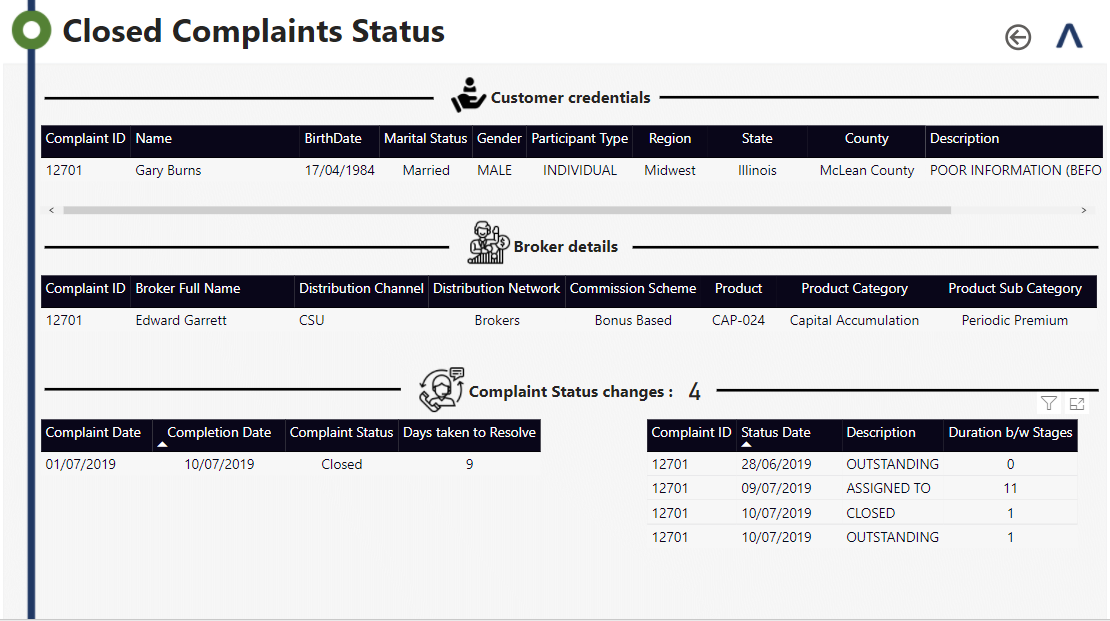
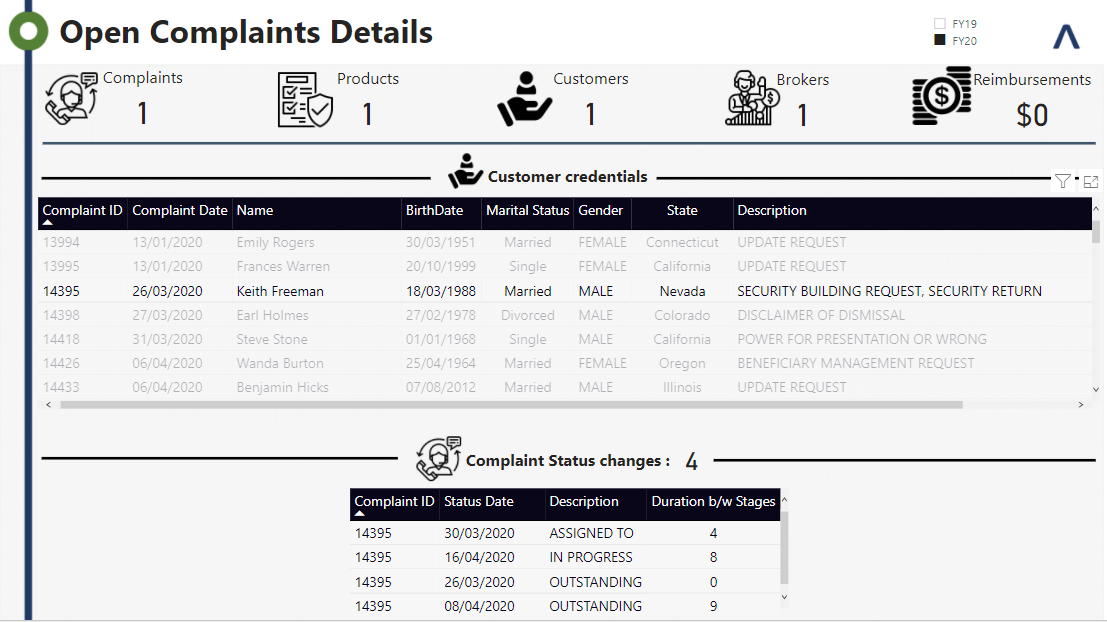
- added [Status Group] to [Status] table, with “Closed” and “Resolved” status values assigned to the “Closed” group, with all others assigned to the “Open” group
M/Power Query:
- added fxNow, fxToday [date of fxNow], fxFirstComplaint [min compliant date], fxStartDate [start of year of fxFirstComplaint], fxEndDate [one year after end of year of fxToday]
DAX Calculations:
- added [Is Desktop] and [Is Service] using difference between NOW() and UTCNOW() to determine user interface
Visualizations:
Custom Visuals:
- used Enlighten Data Story custom visual
- used Sunbust by MAQ Software custom visual
General:
- used blank buttons in header with separate “default” and “on hover” images, all using “Fill\Image Fit\Fit” for back and forward; used slightly larger copies of the default images to create the “bounce” effect on hover (with “Fit”, larger image appears smaller in same size box)
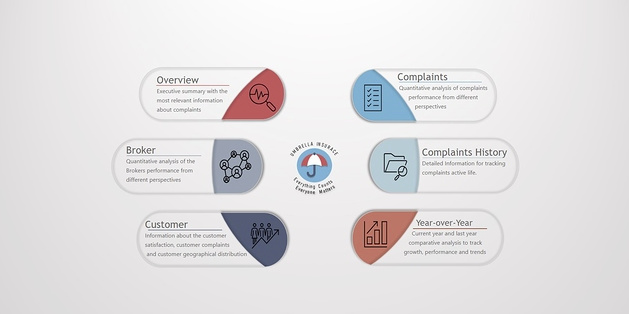
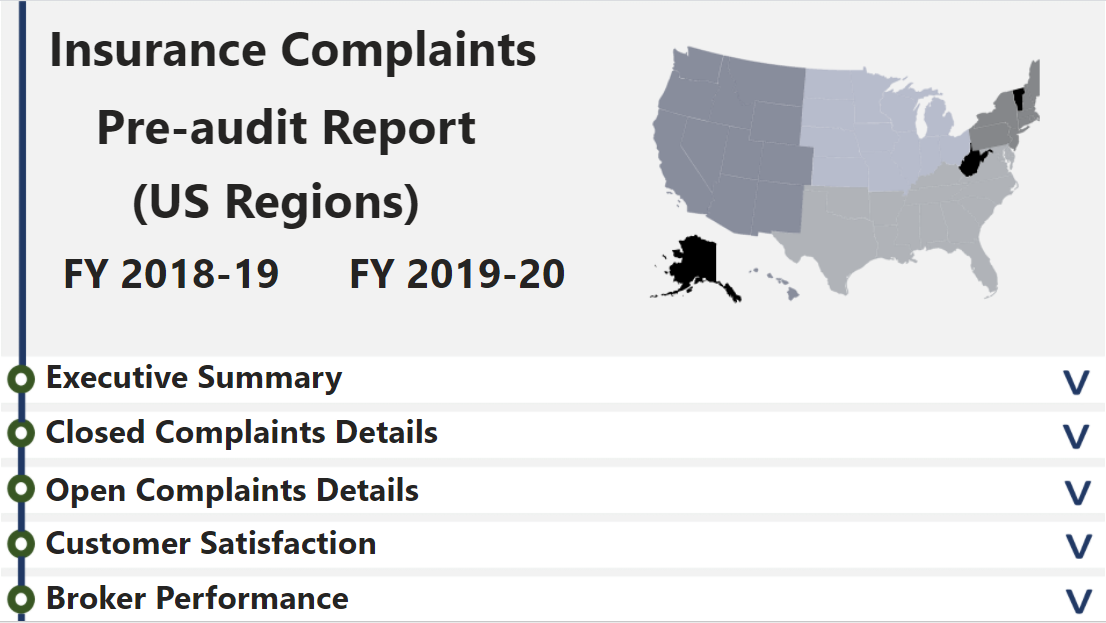
- hid all pages except “Summary” page, so all navigation in Power BI Service would be via back and forward buttons
- used multi-row card in footer to display report info
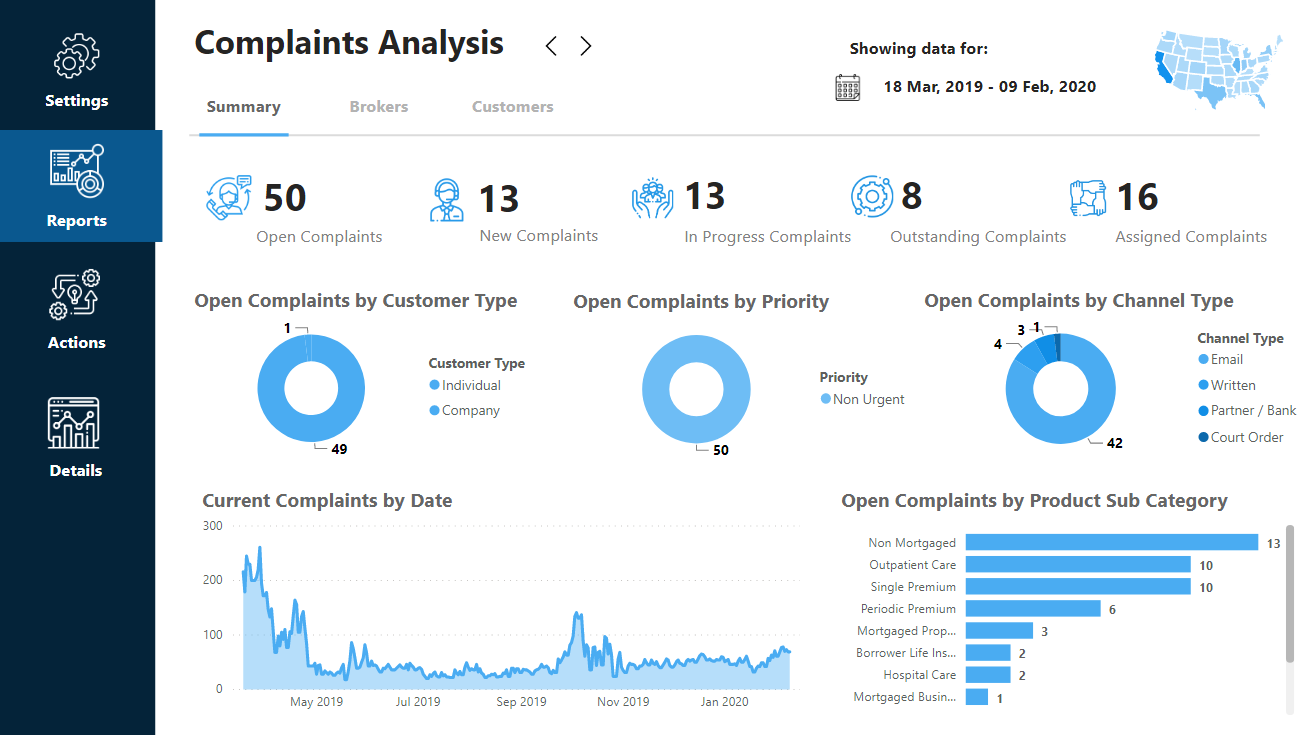
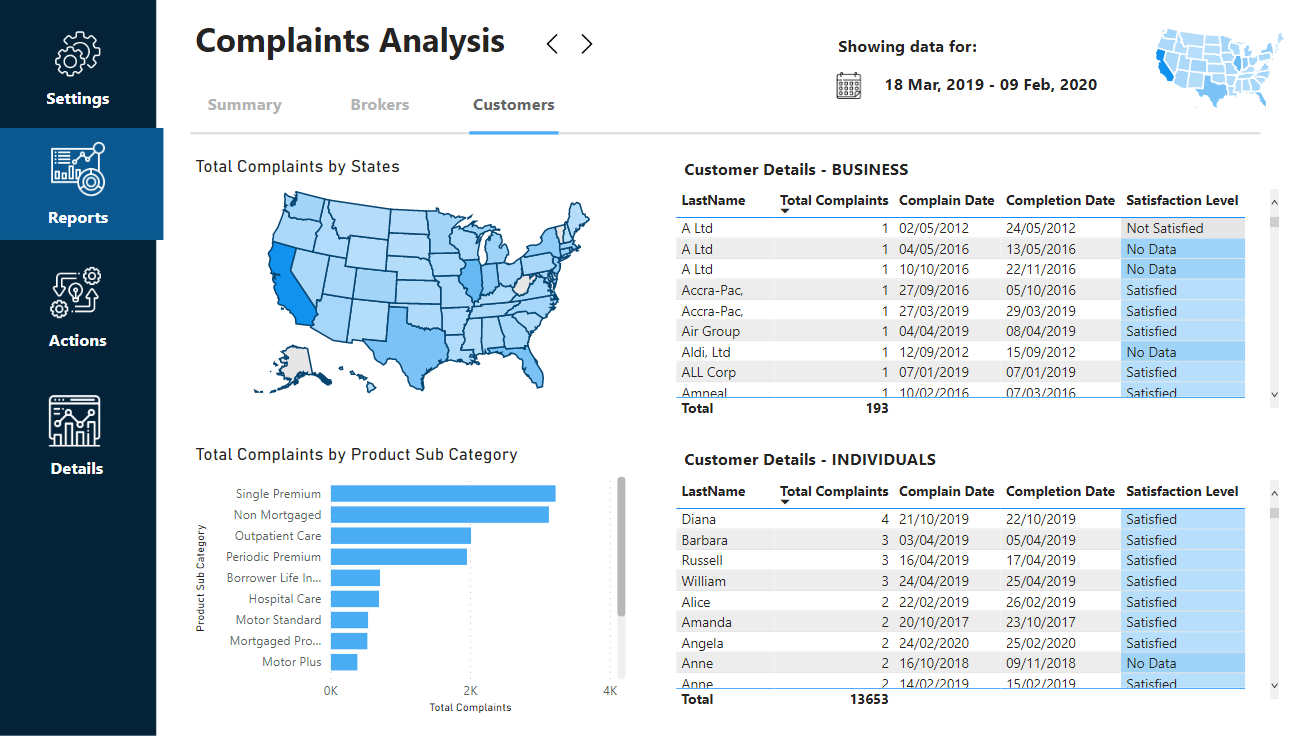
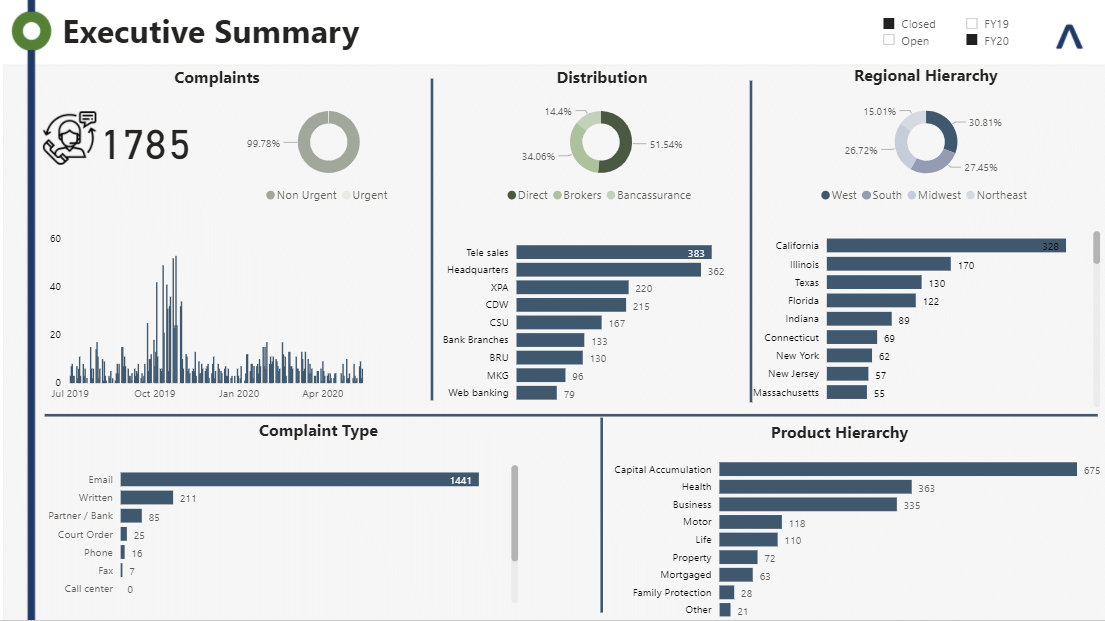
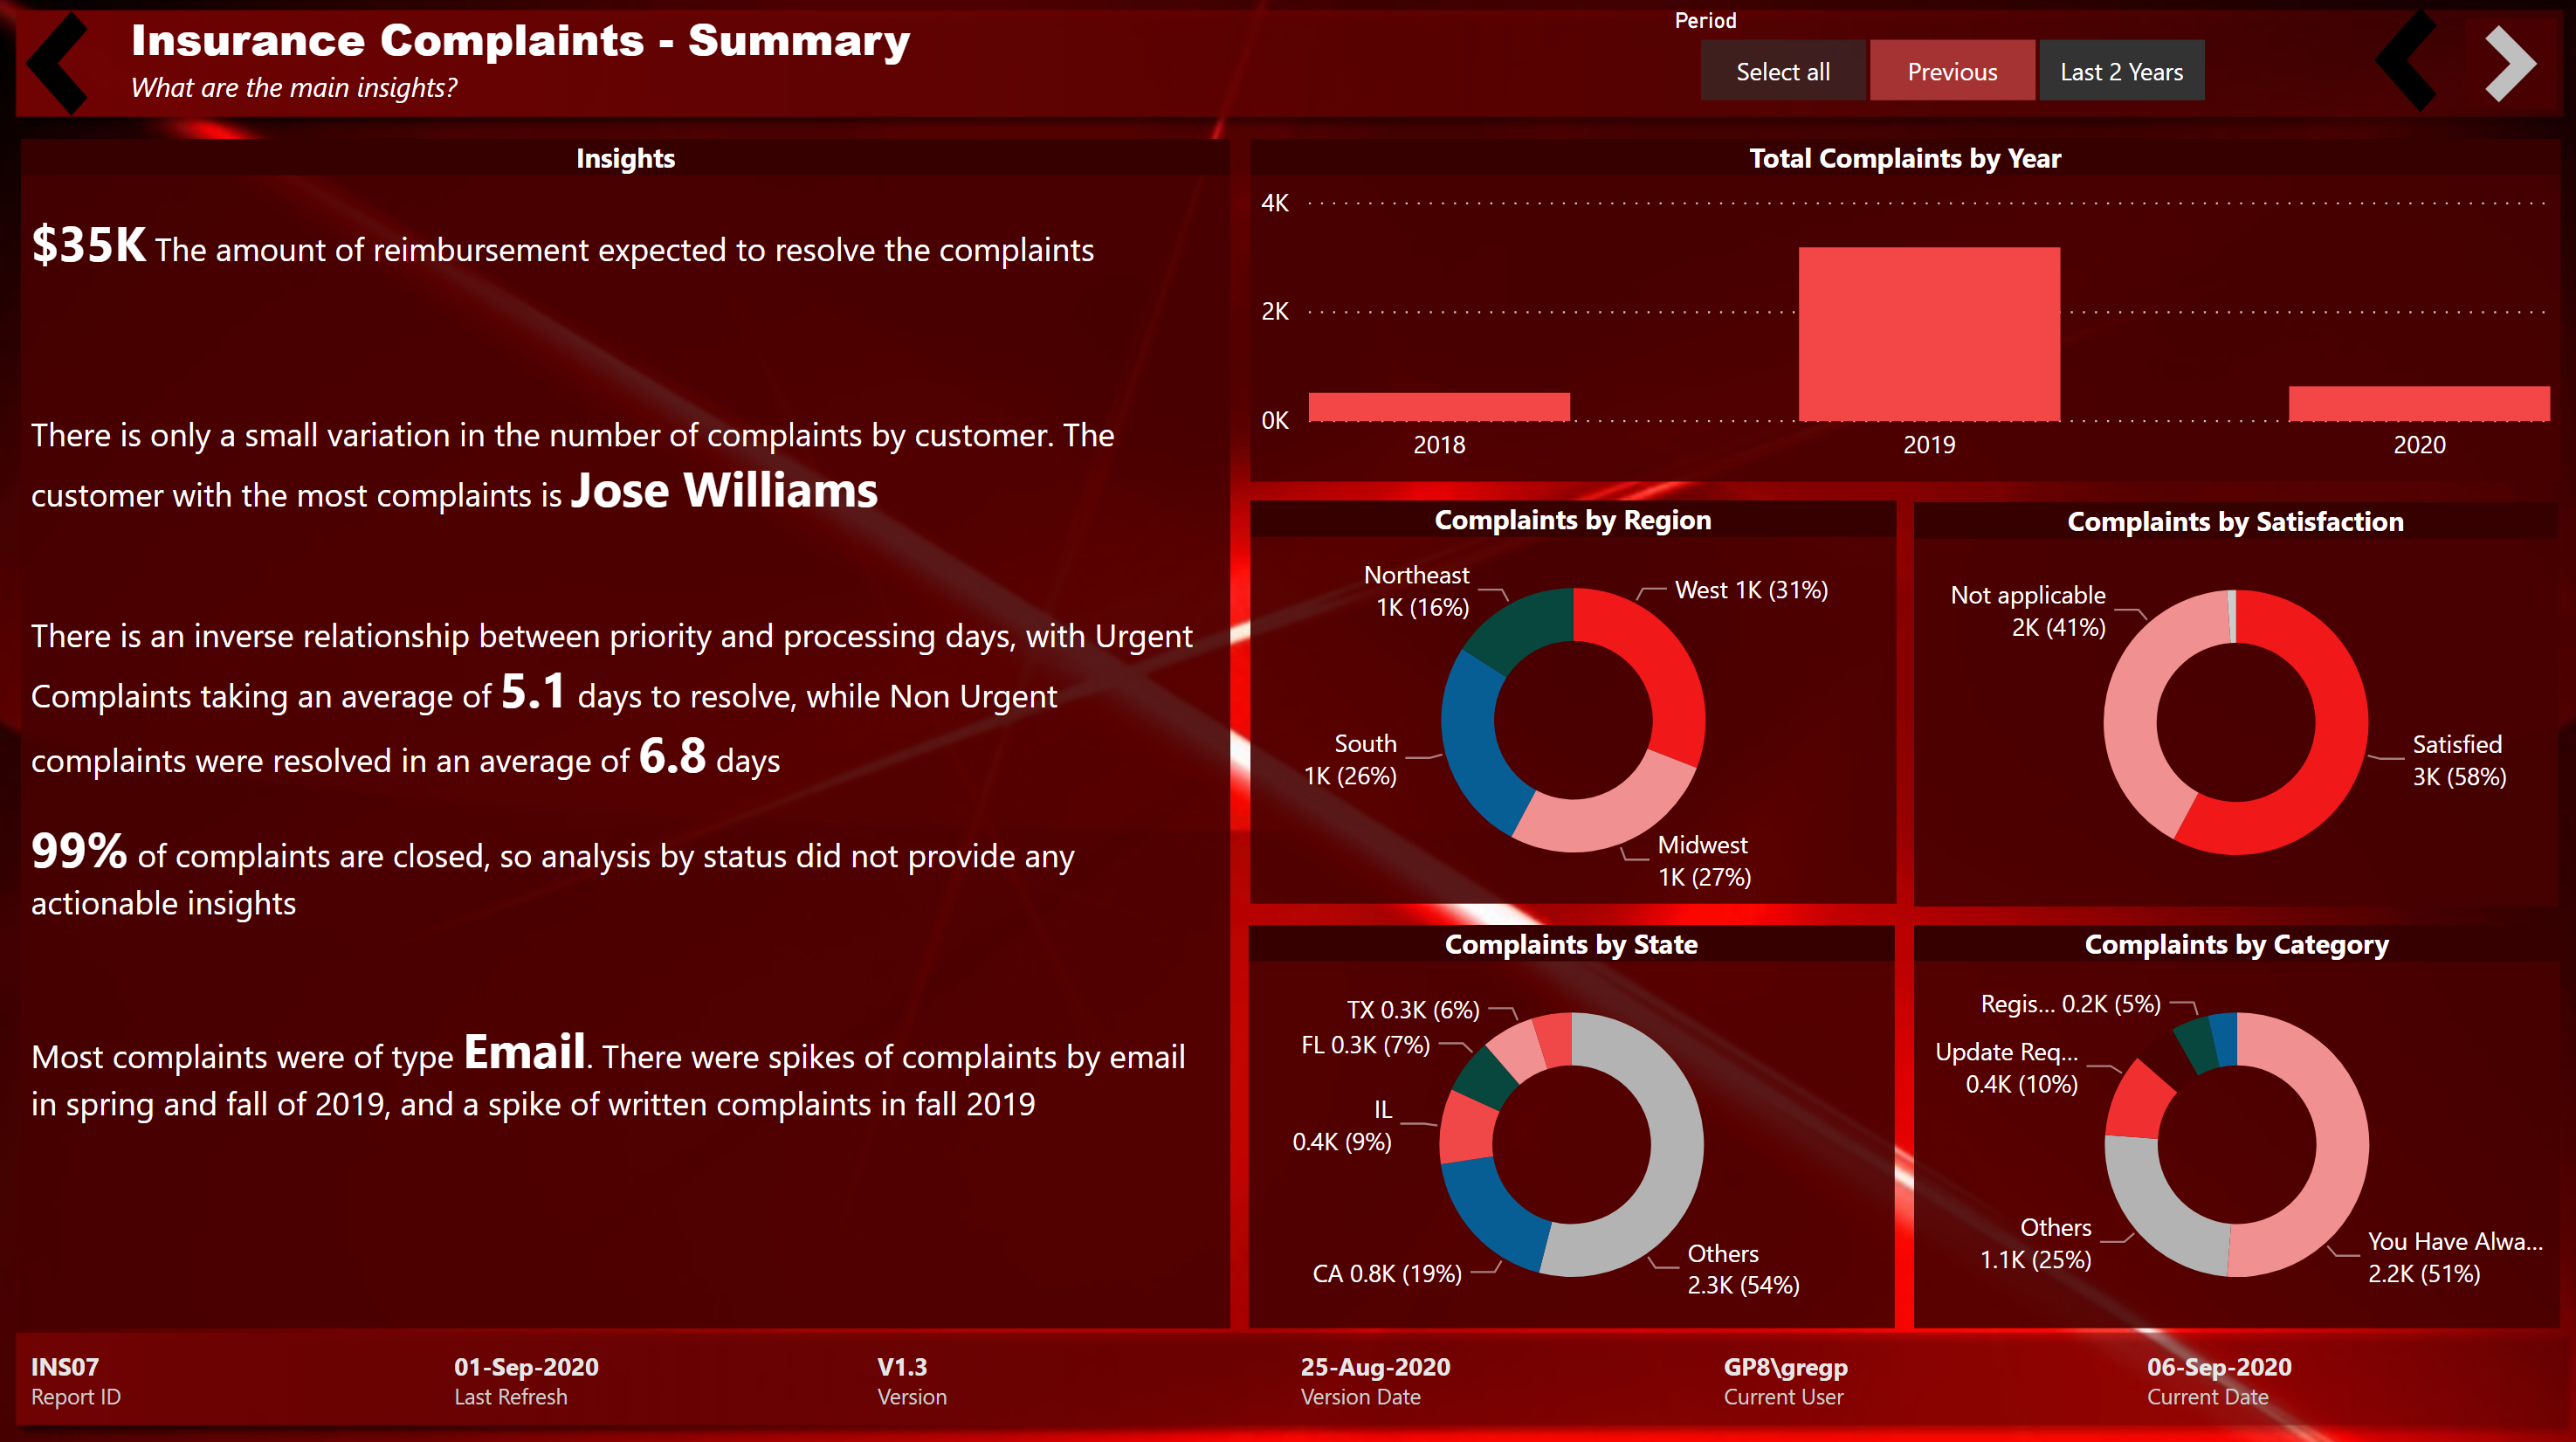
Summary page:
- used transparent black “back” image instead of back button to show “start”
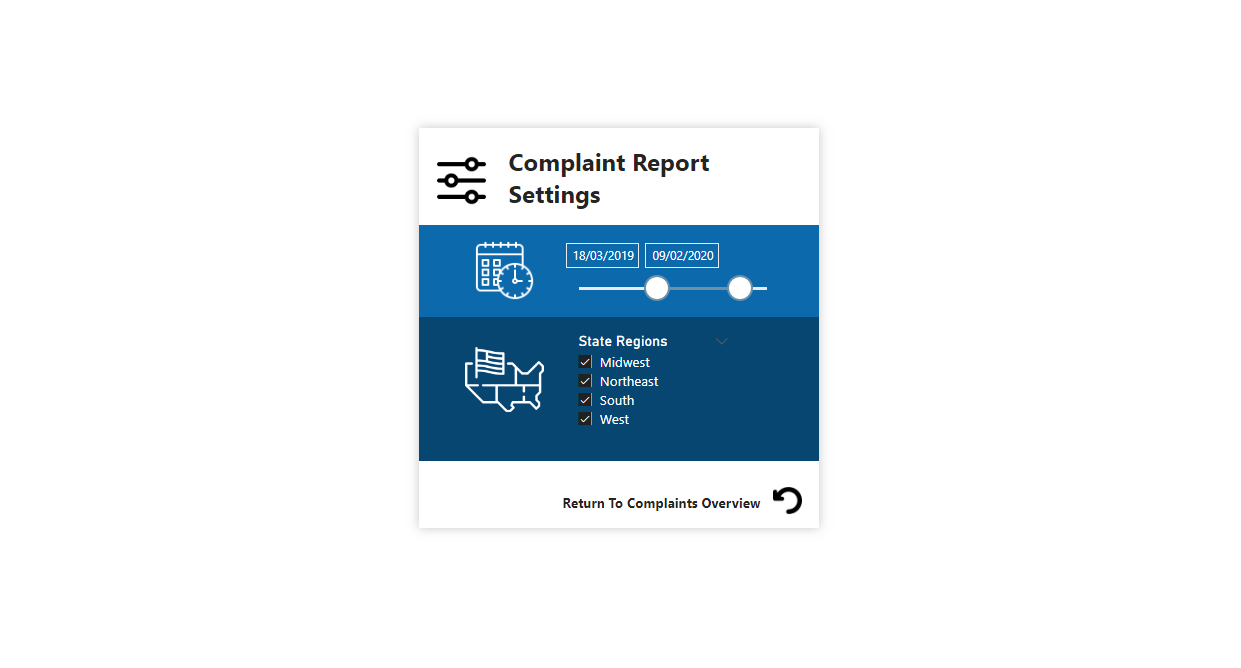
- added [Periods] slicer to easily display last 2 years
- used many instances of the Enlighten Data Story custom visual on the left side of the page to present summary insights
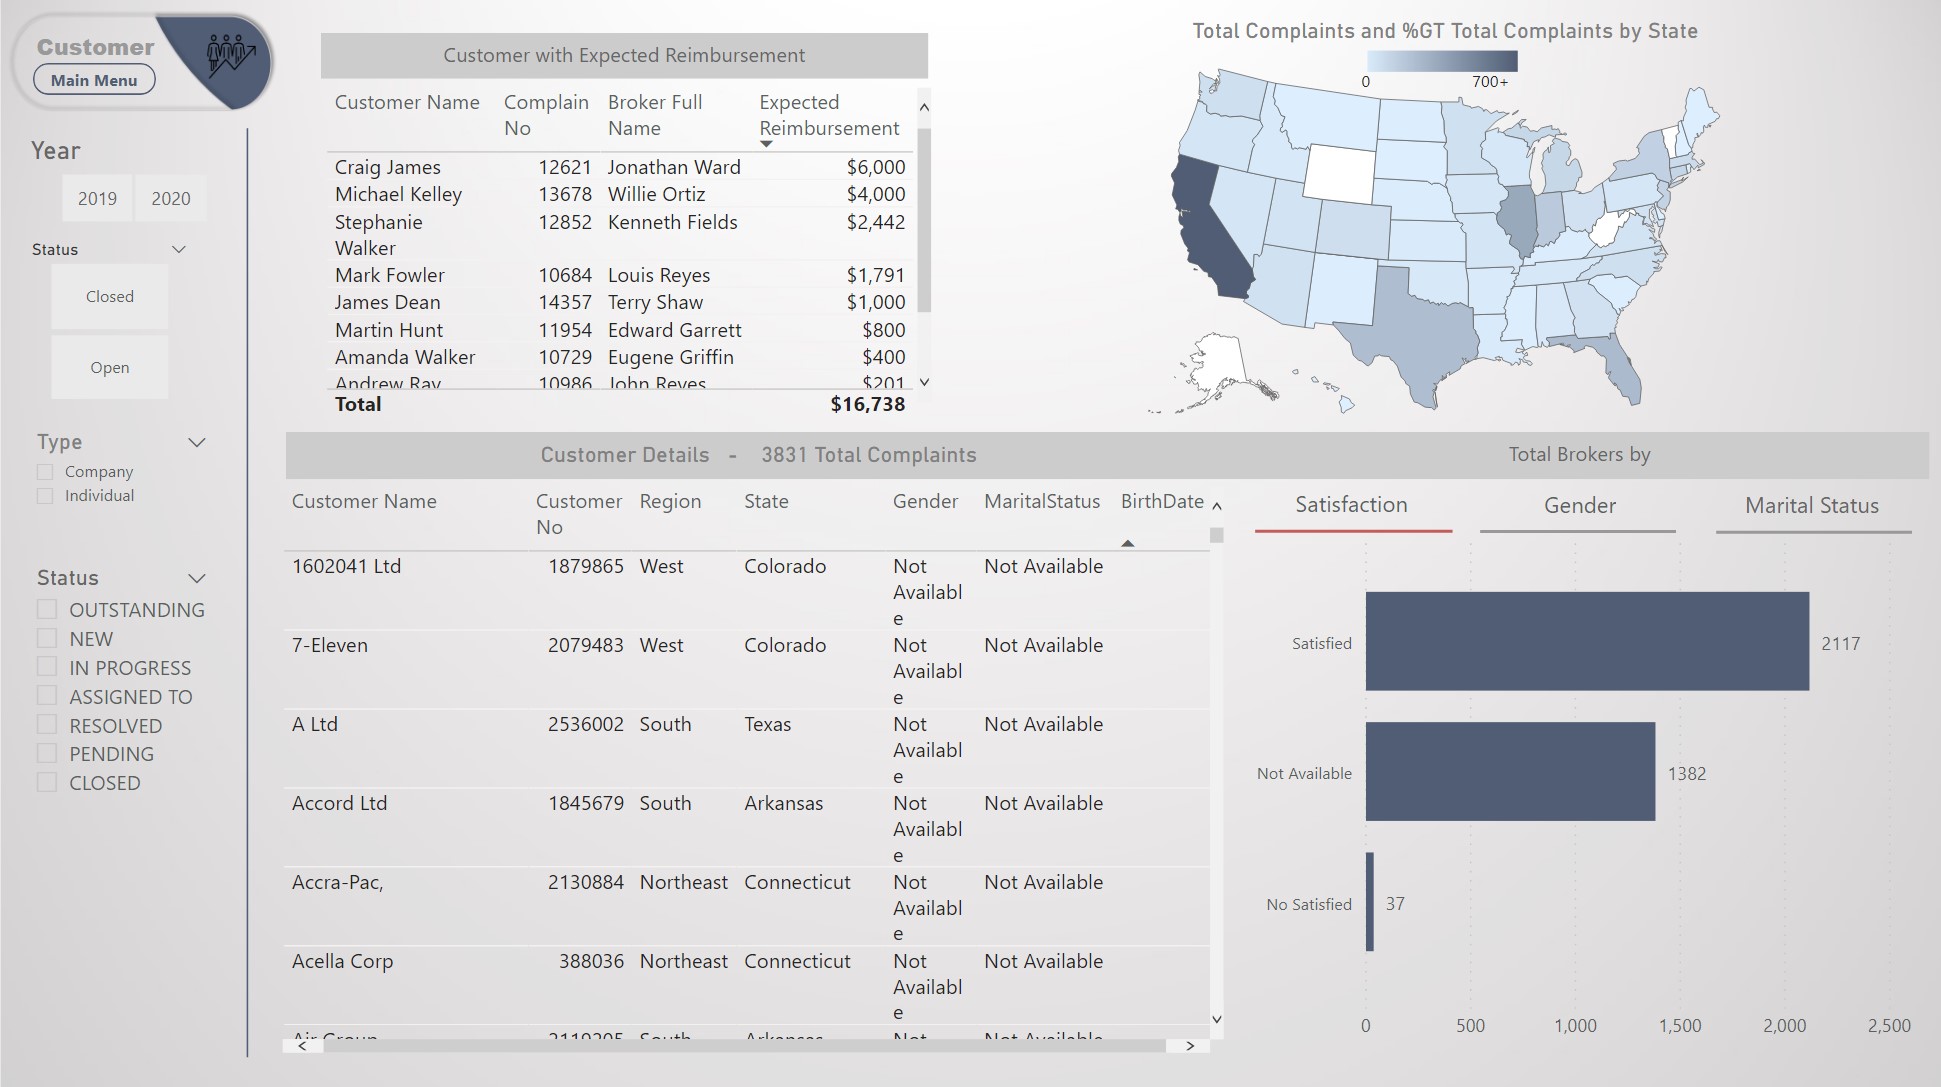
- used [Top States plus Others] in doughnut visual ([TopX] set to 5, so will show 5 slices for the Top 5 states plus a 6th slice for “Others” [sum of values outside the Top 5])
- used [Top Categories plus Others] in doughnut visual ([TopX] set to 5, so will show 5 slices for the Top 5 categories plus a 6th slice for “Others” [sum of values outside the Top 5])
- used multi-row card in the footer to present report admin and session admin measures
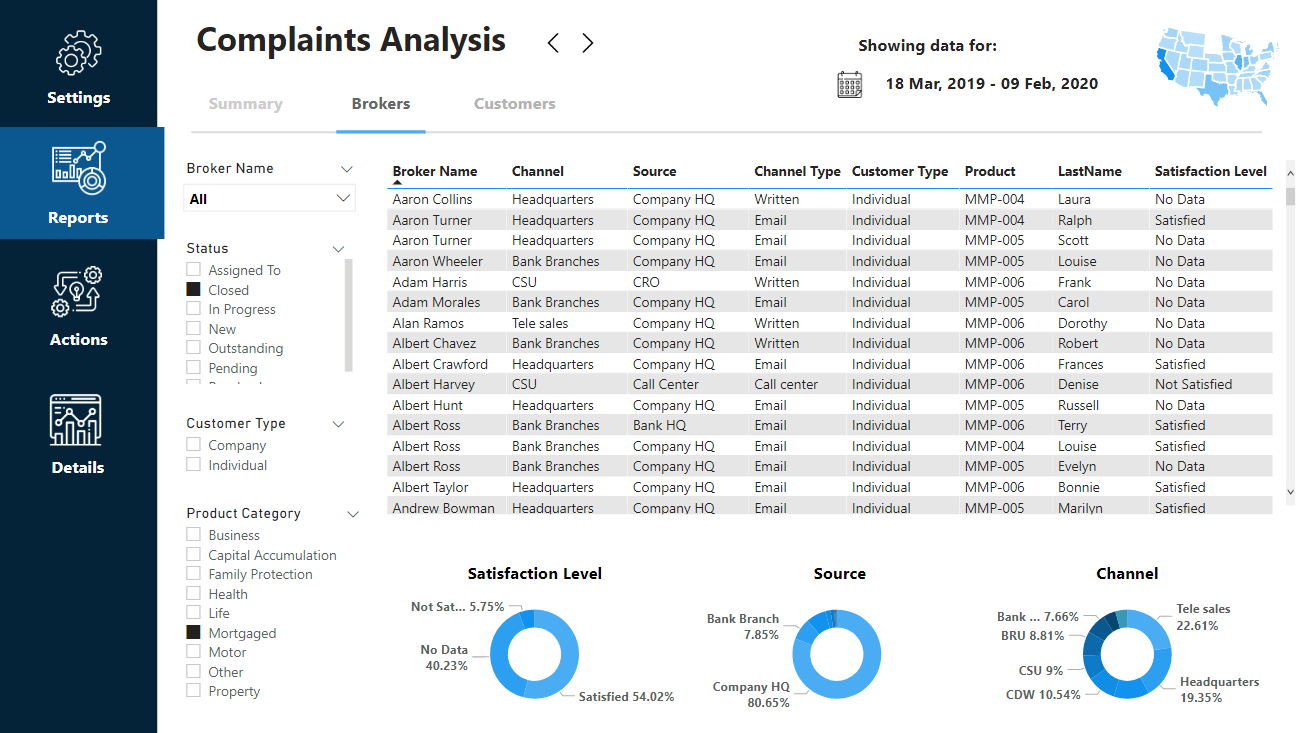
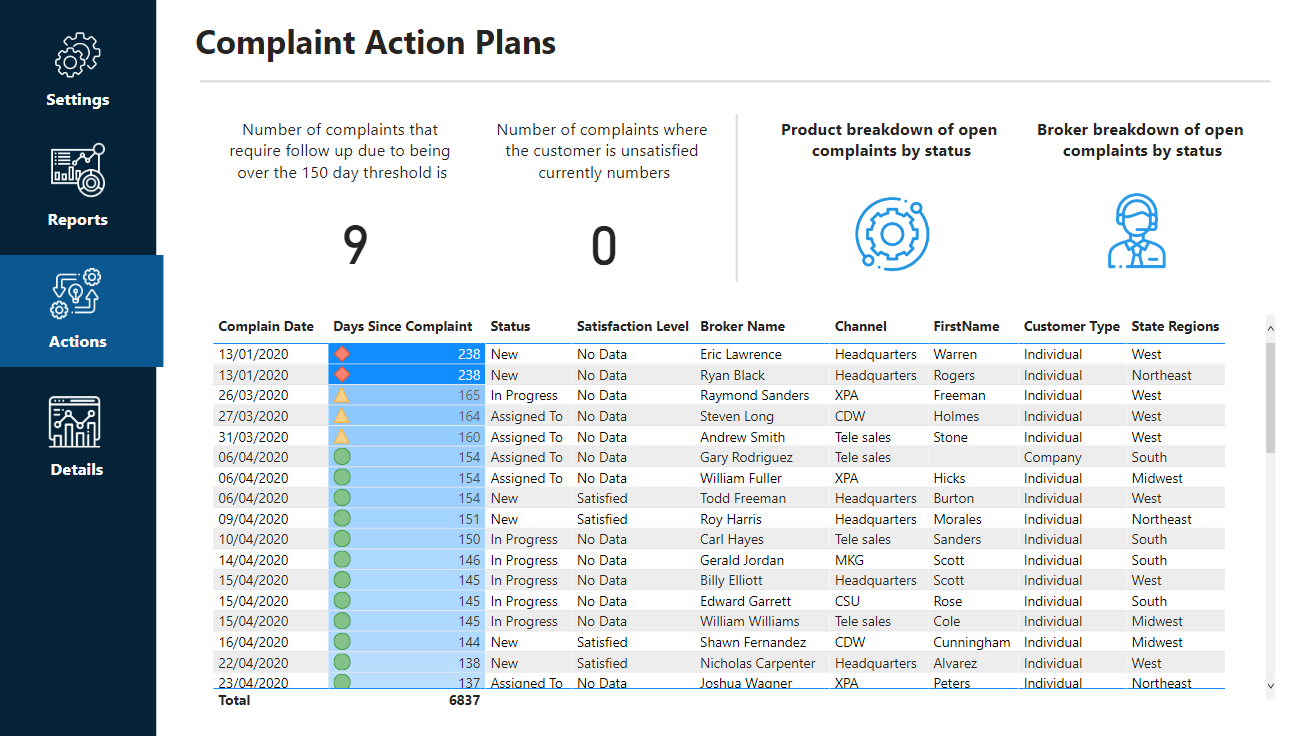
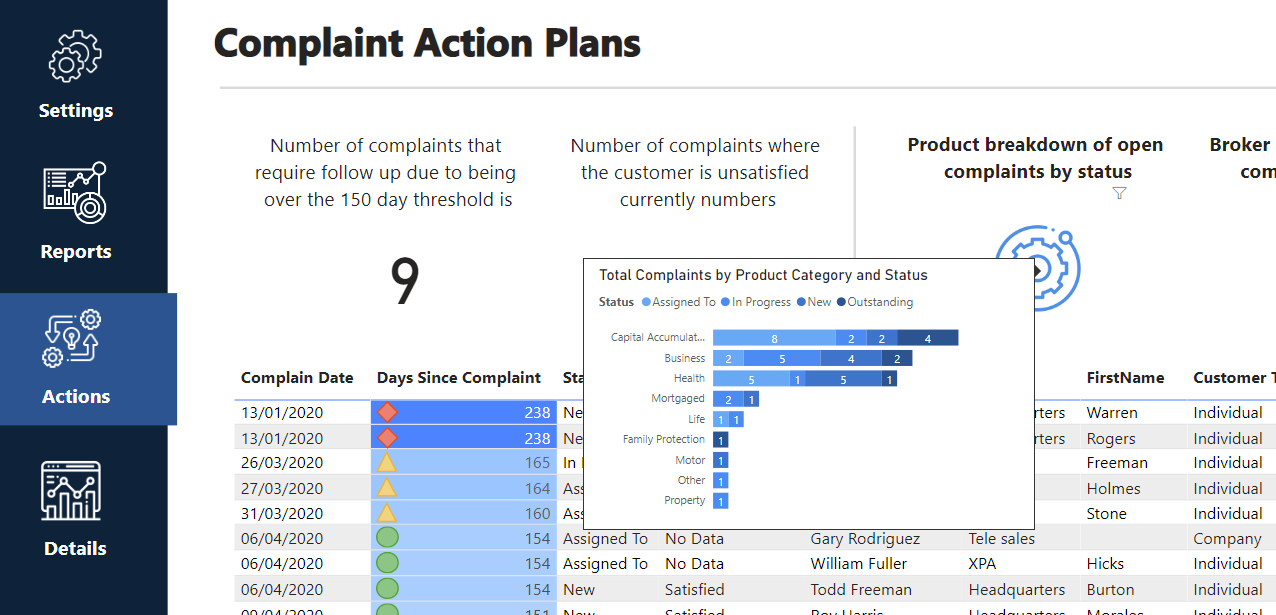
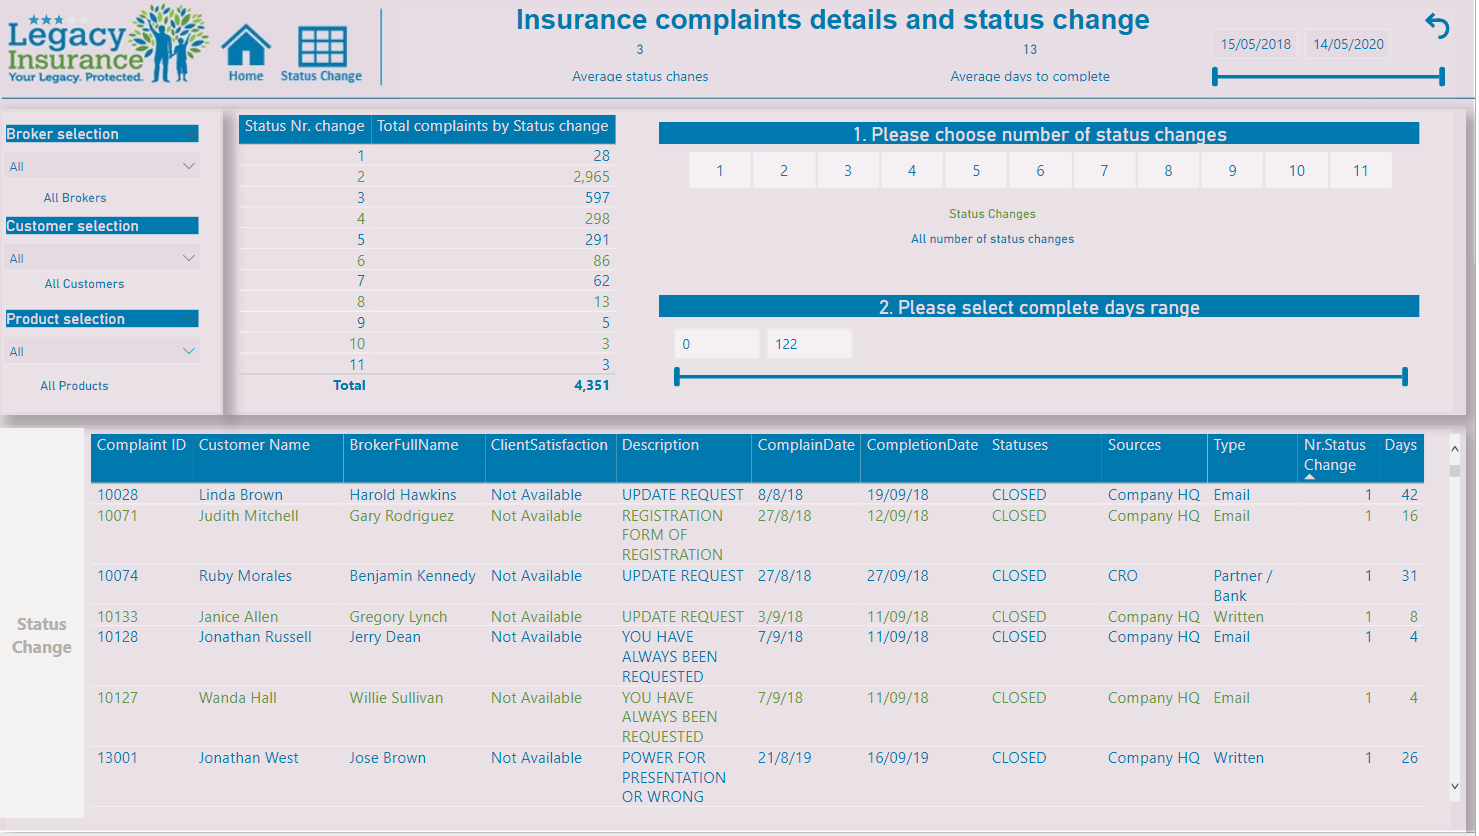
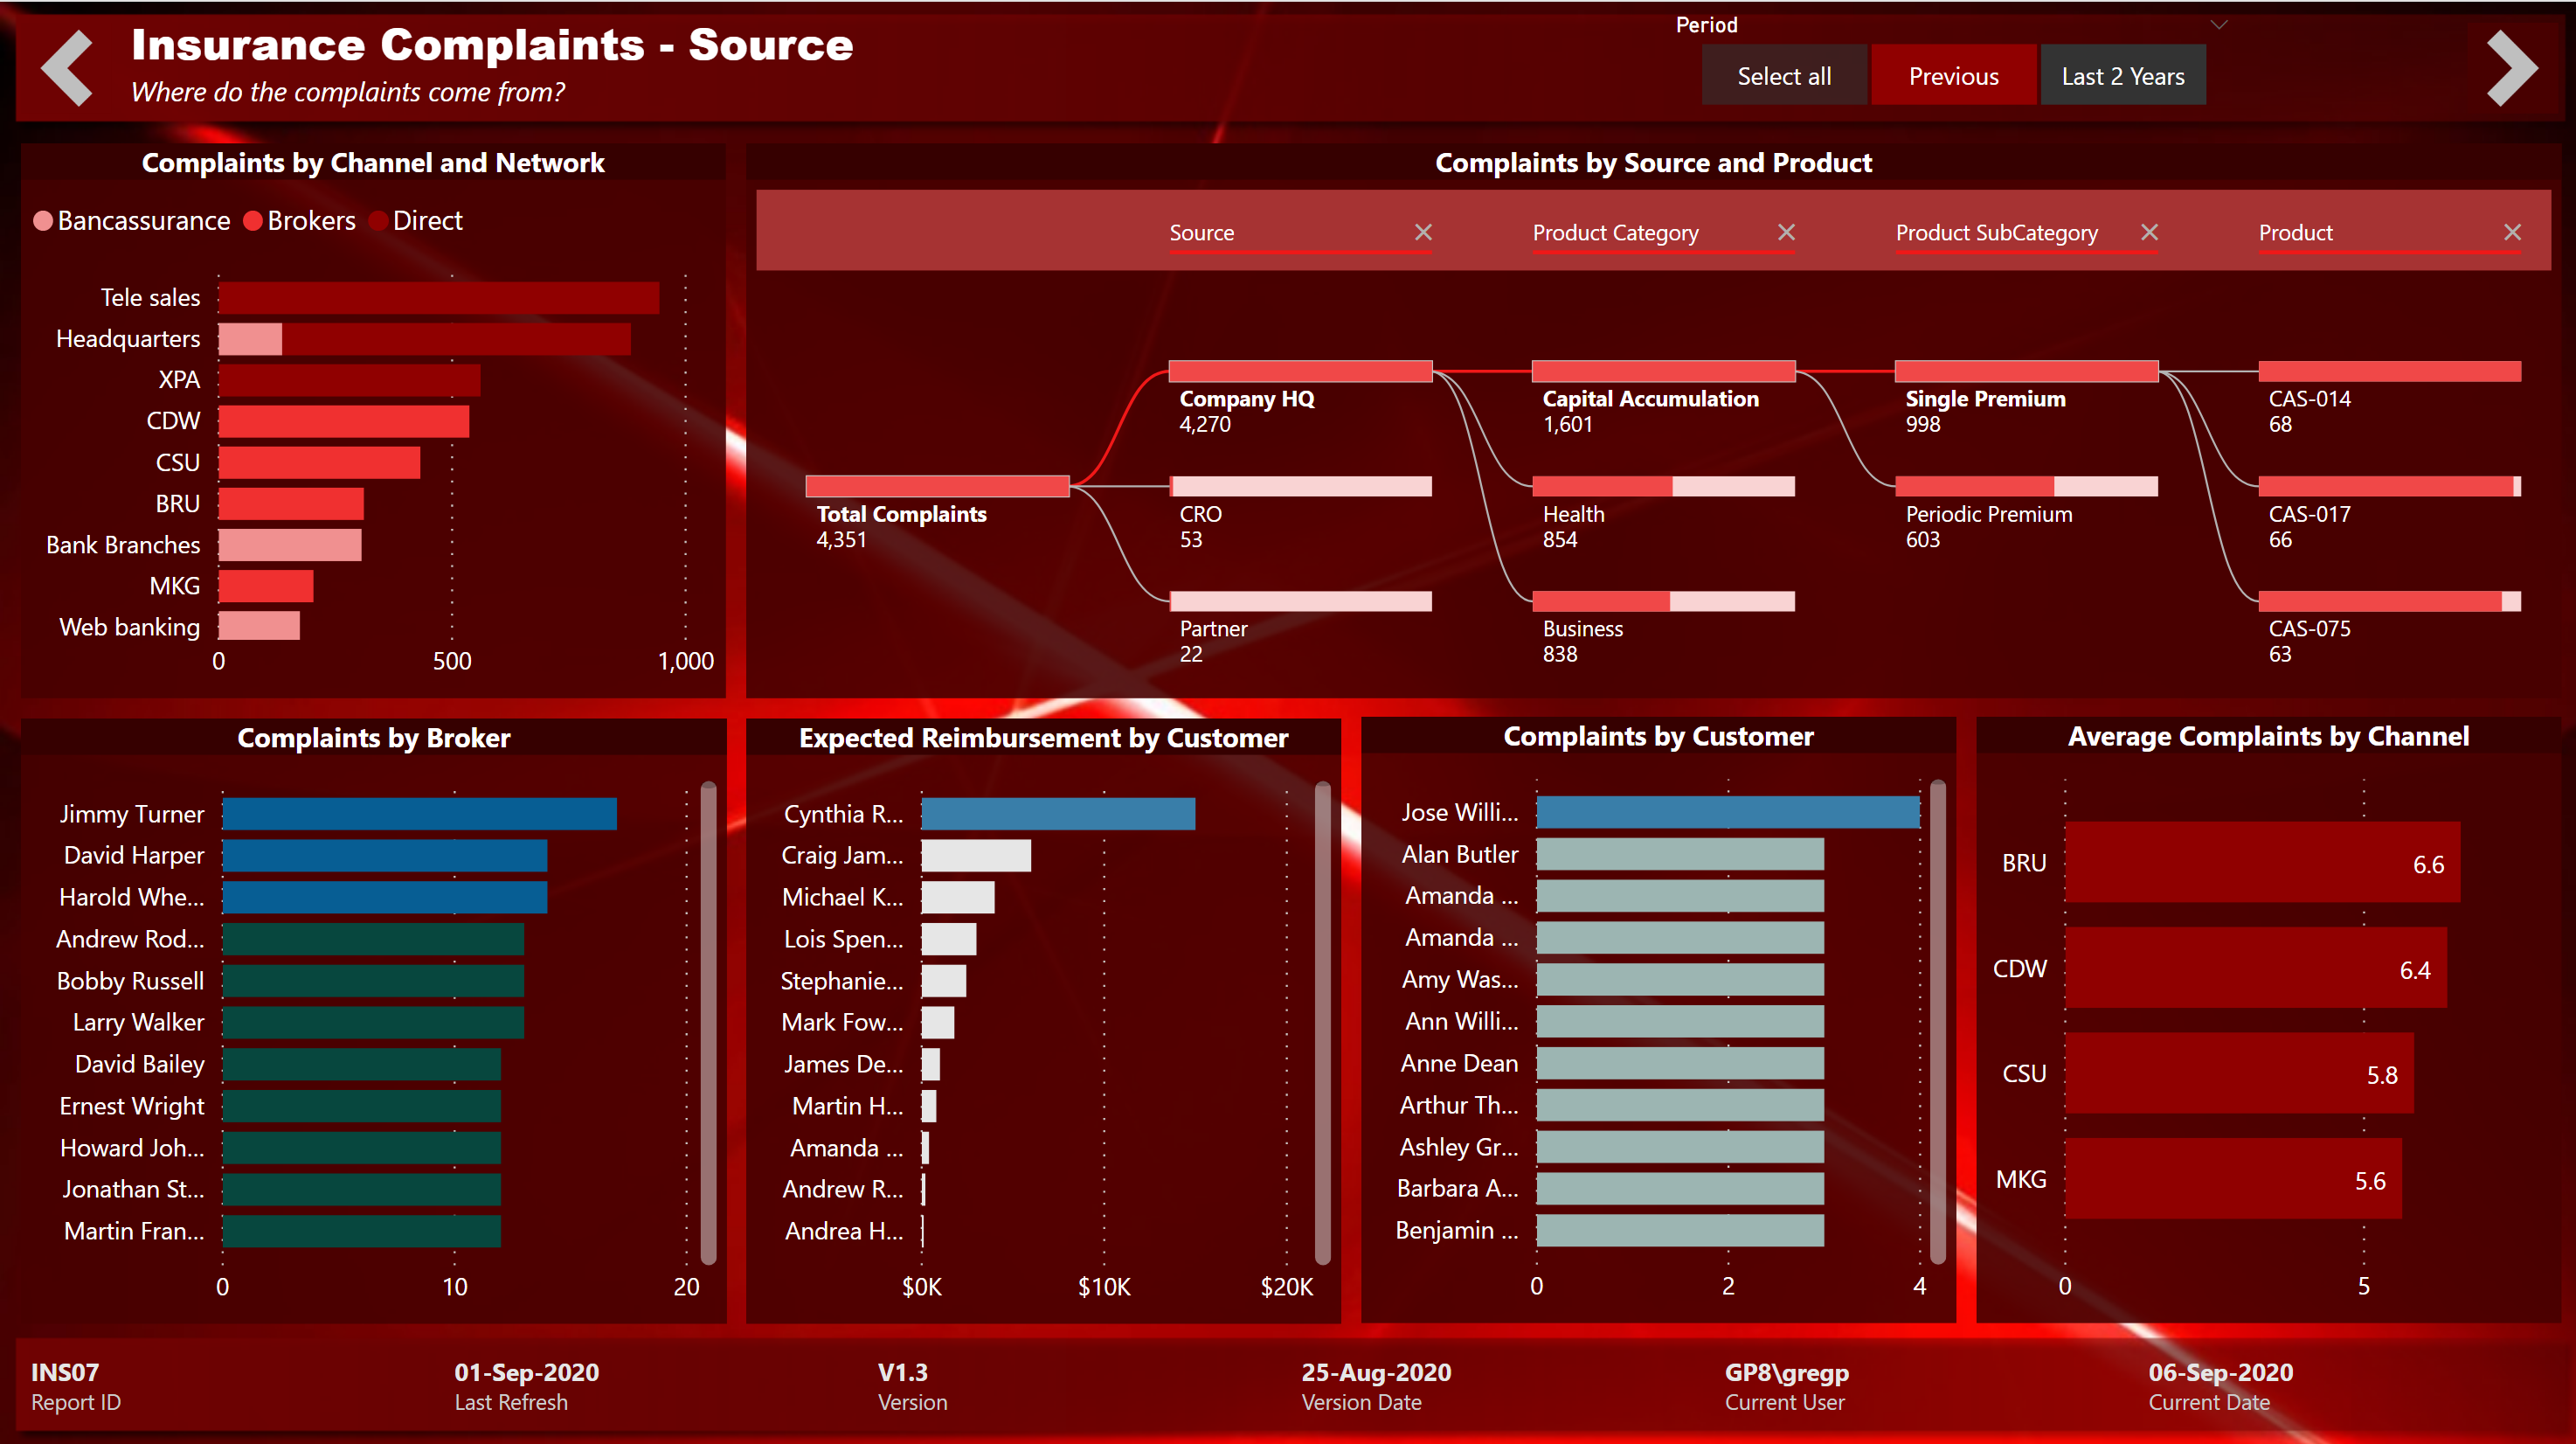
Source page:
- added [Periods] slicer to easily display last 2 years
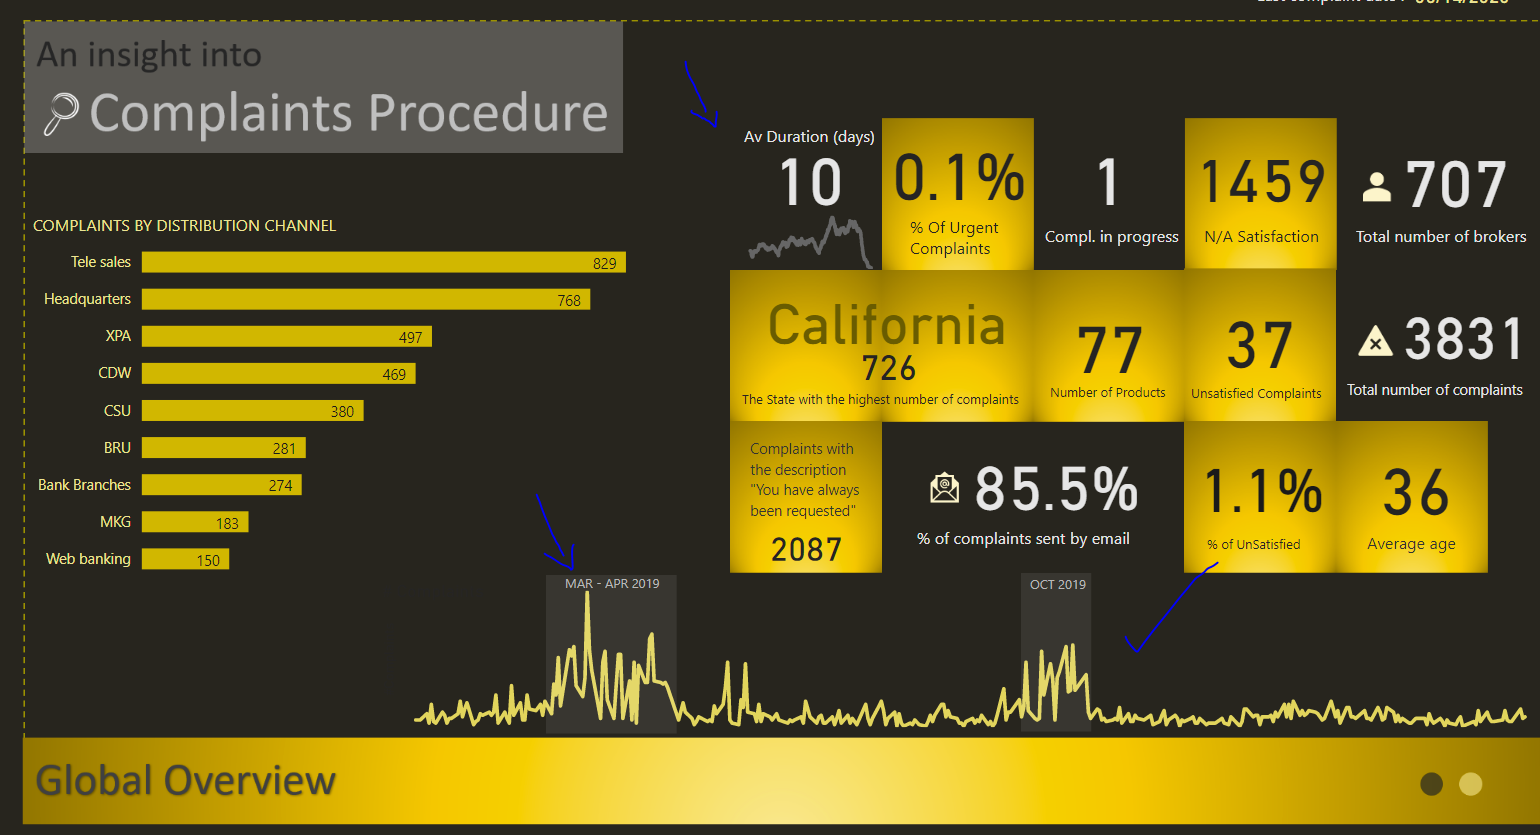
- used Decomposition Tree to identify breakdown of complaints by source, product category, product subcategory
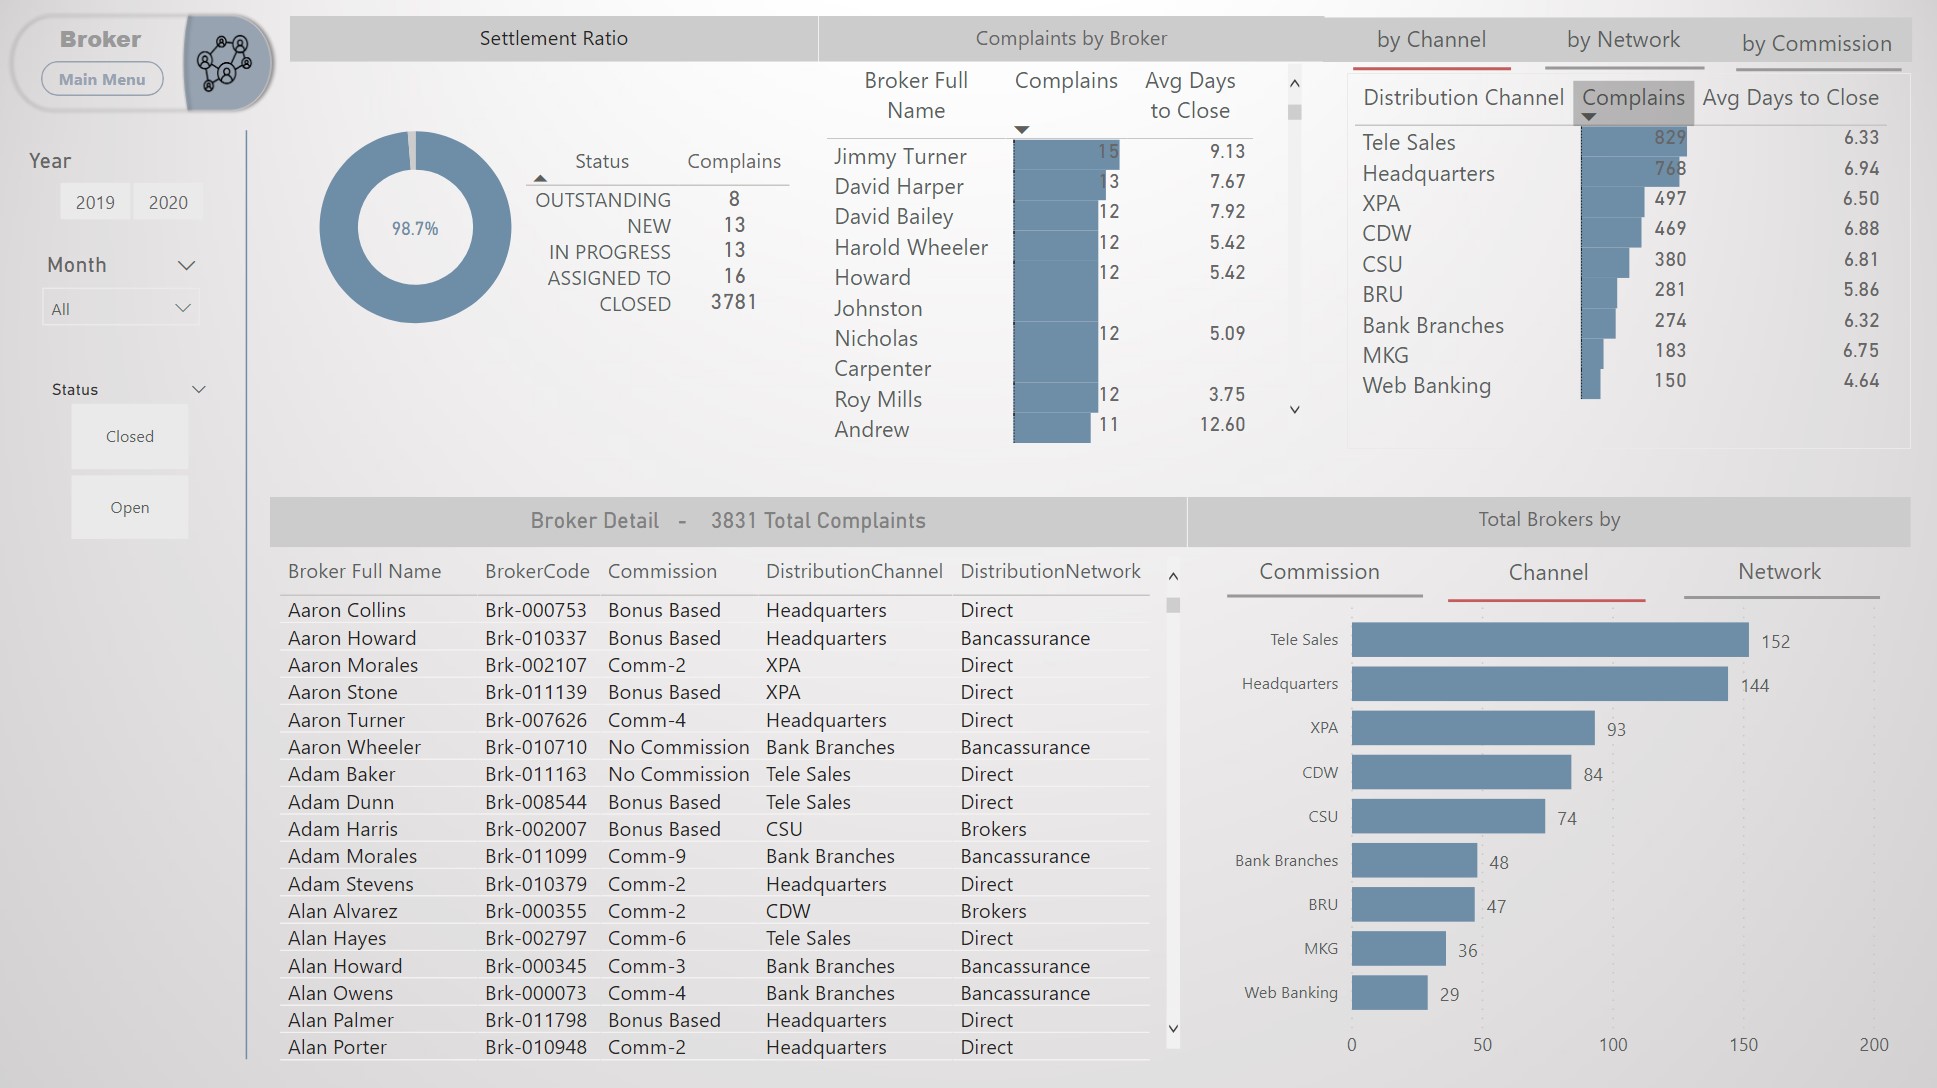
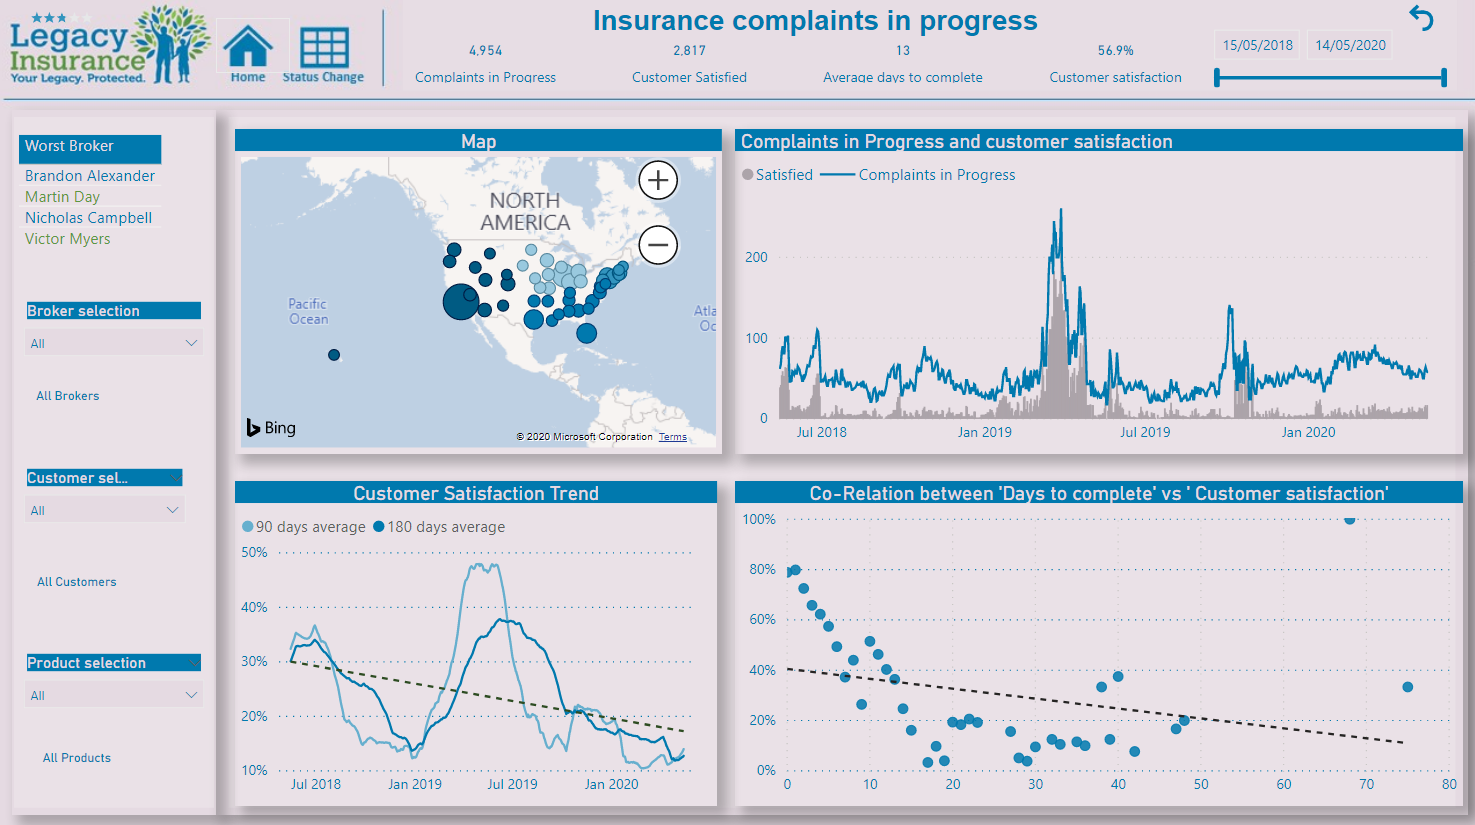
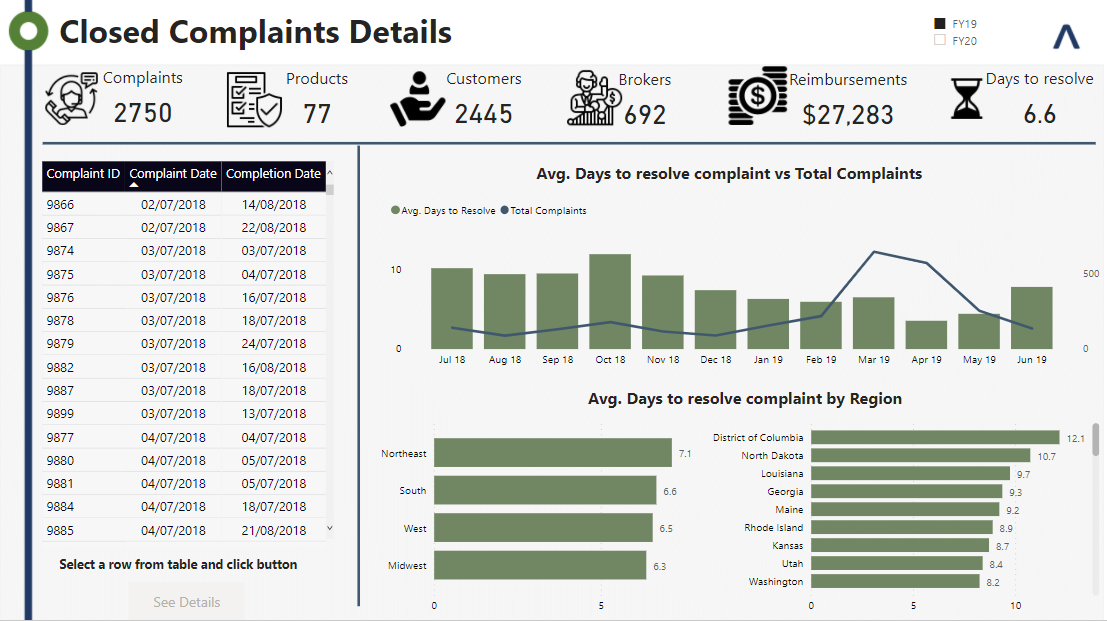
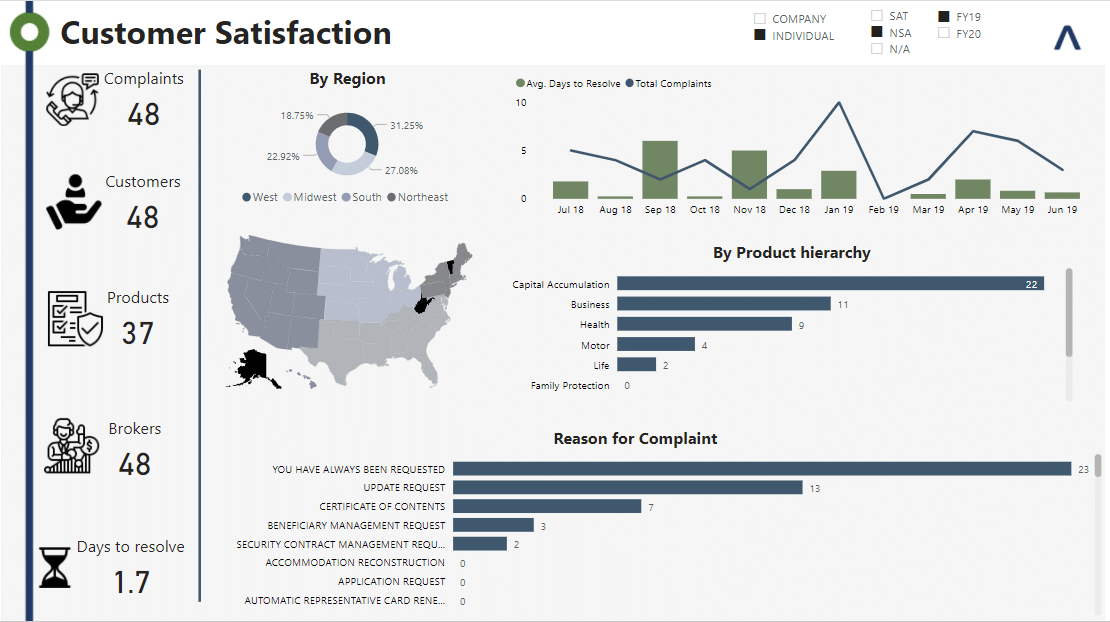
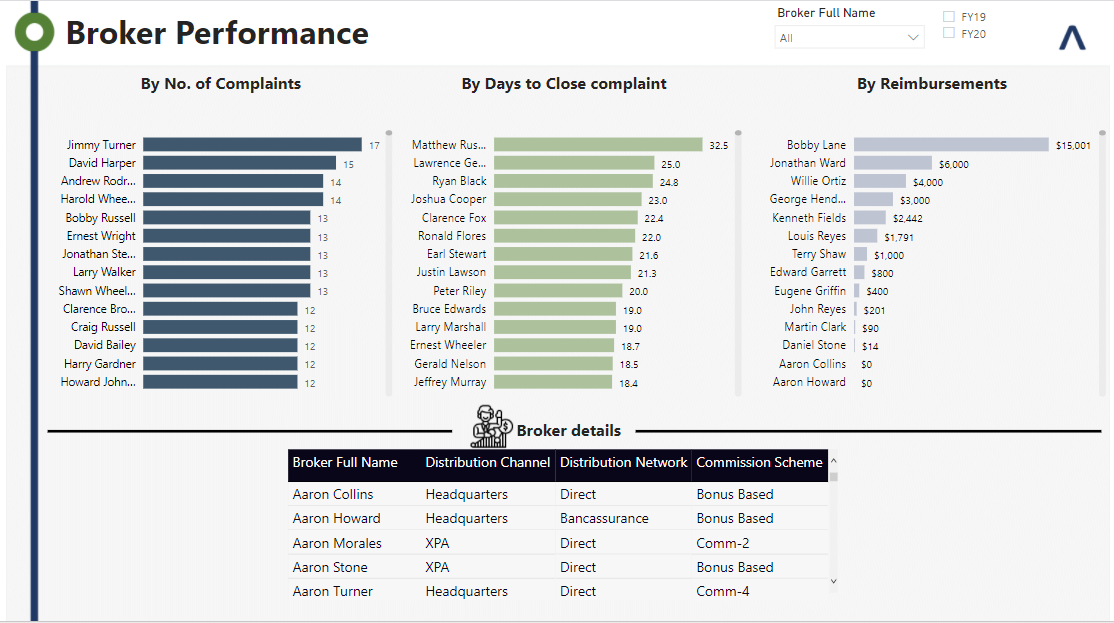
- used conditional formatting to colour 3 groups in the [Complaints by Broker], [Expected Reimbursement by Customer], and [Complaints by Customer] charts: top 20% - dark red; 50-80% - red; bottom 50% - light red
- used multi-row card in the footer to present report admin and session admin measures
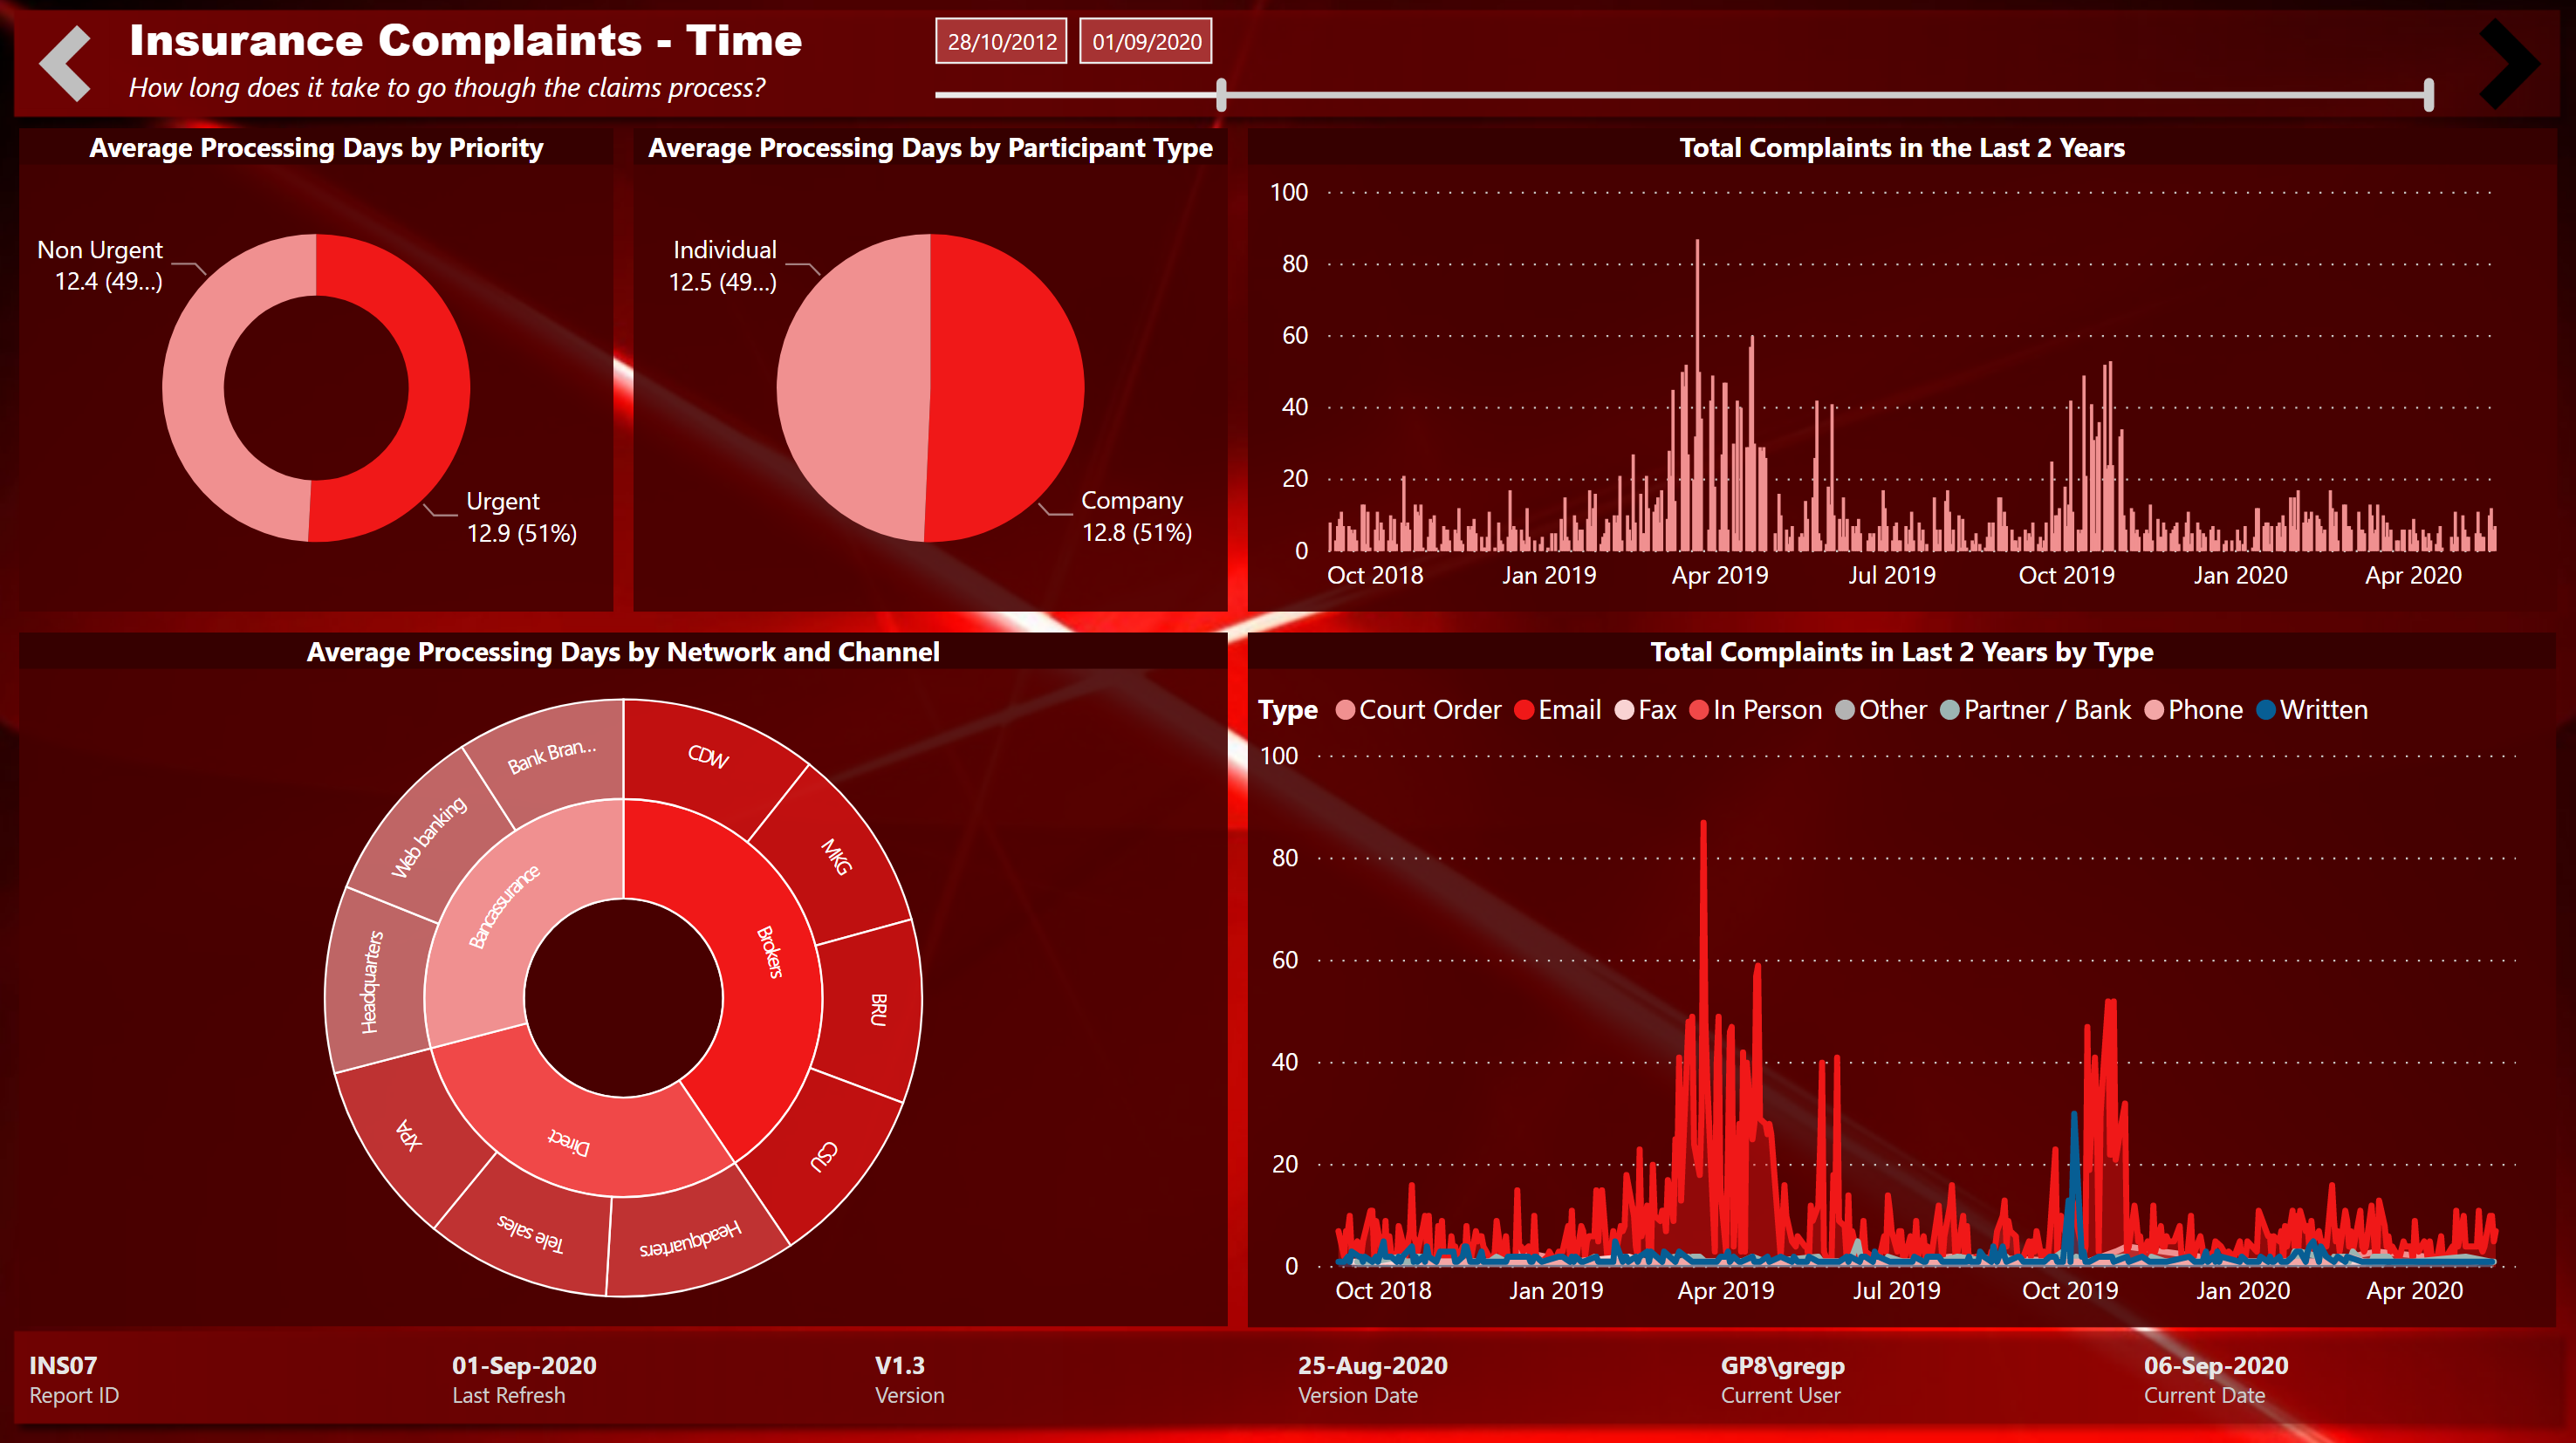
Time page:
- used transparent black “forward” image instead of forward button to show “end”
- used Sunbust by MAQ Software custom visual to showcase average processing days by distribution network and distribution channel, complete with animation
- used relative date slicer to show only the last 2 years of complaints data in the two graphs on the right; adjusted the filter interactions so that these two graphs would not be affected by the date slicer selections
- used multi-row card in the footer to present report admin and session admin measures