Here is my submission to Challenge # 5:
At last finished the challenge # 5. Very very busy schedule but managed to complete the task. I went down the rabbit hole but managed to learn a lot during the process.
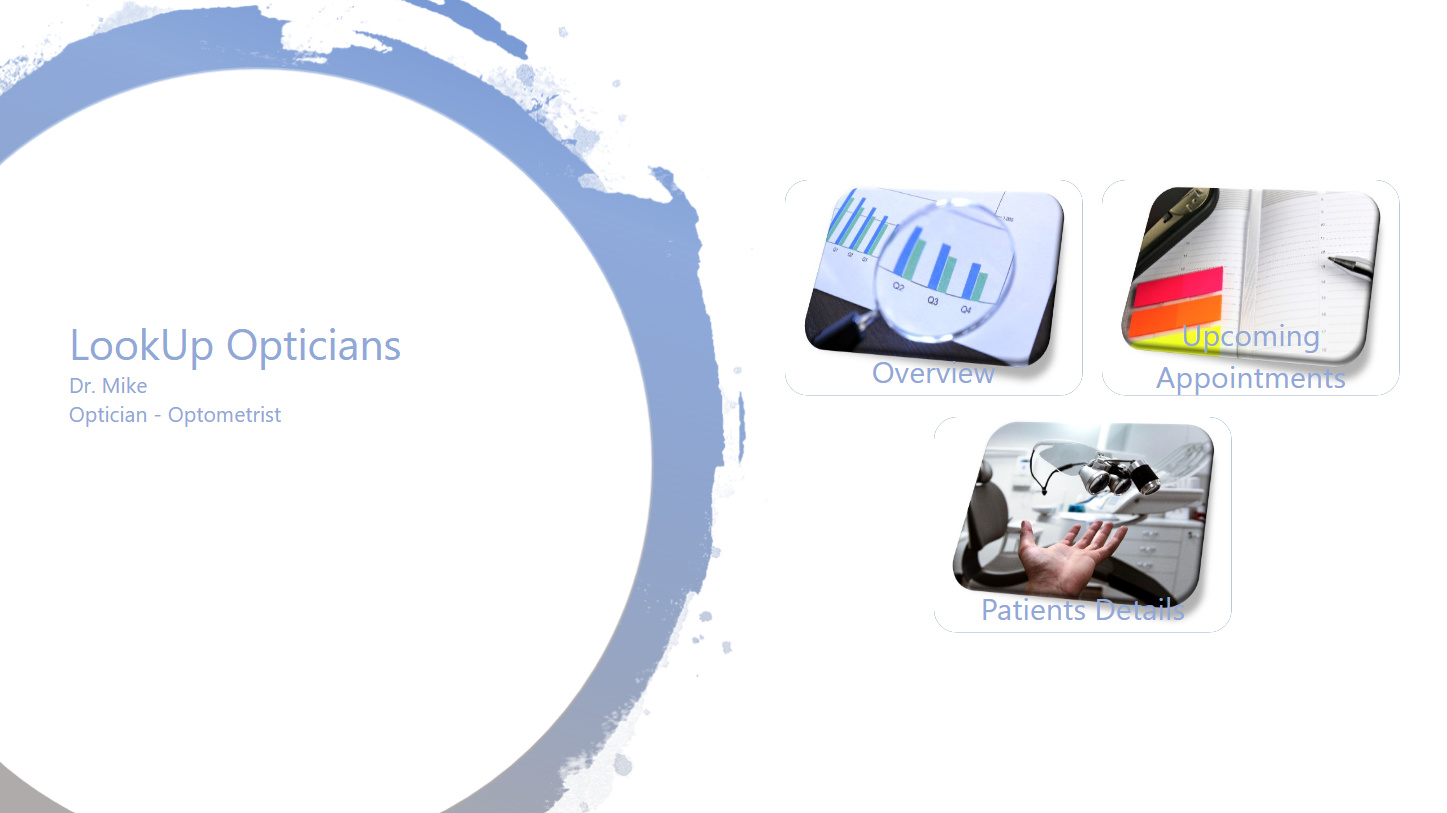
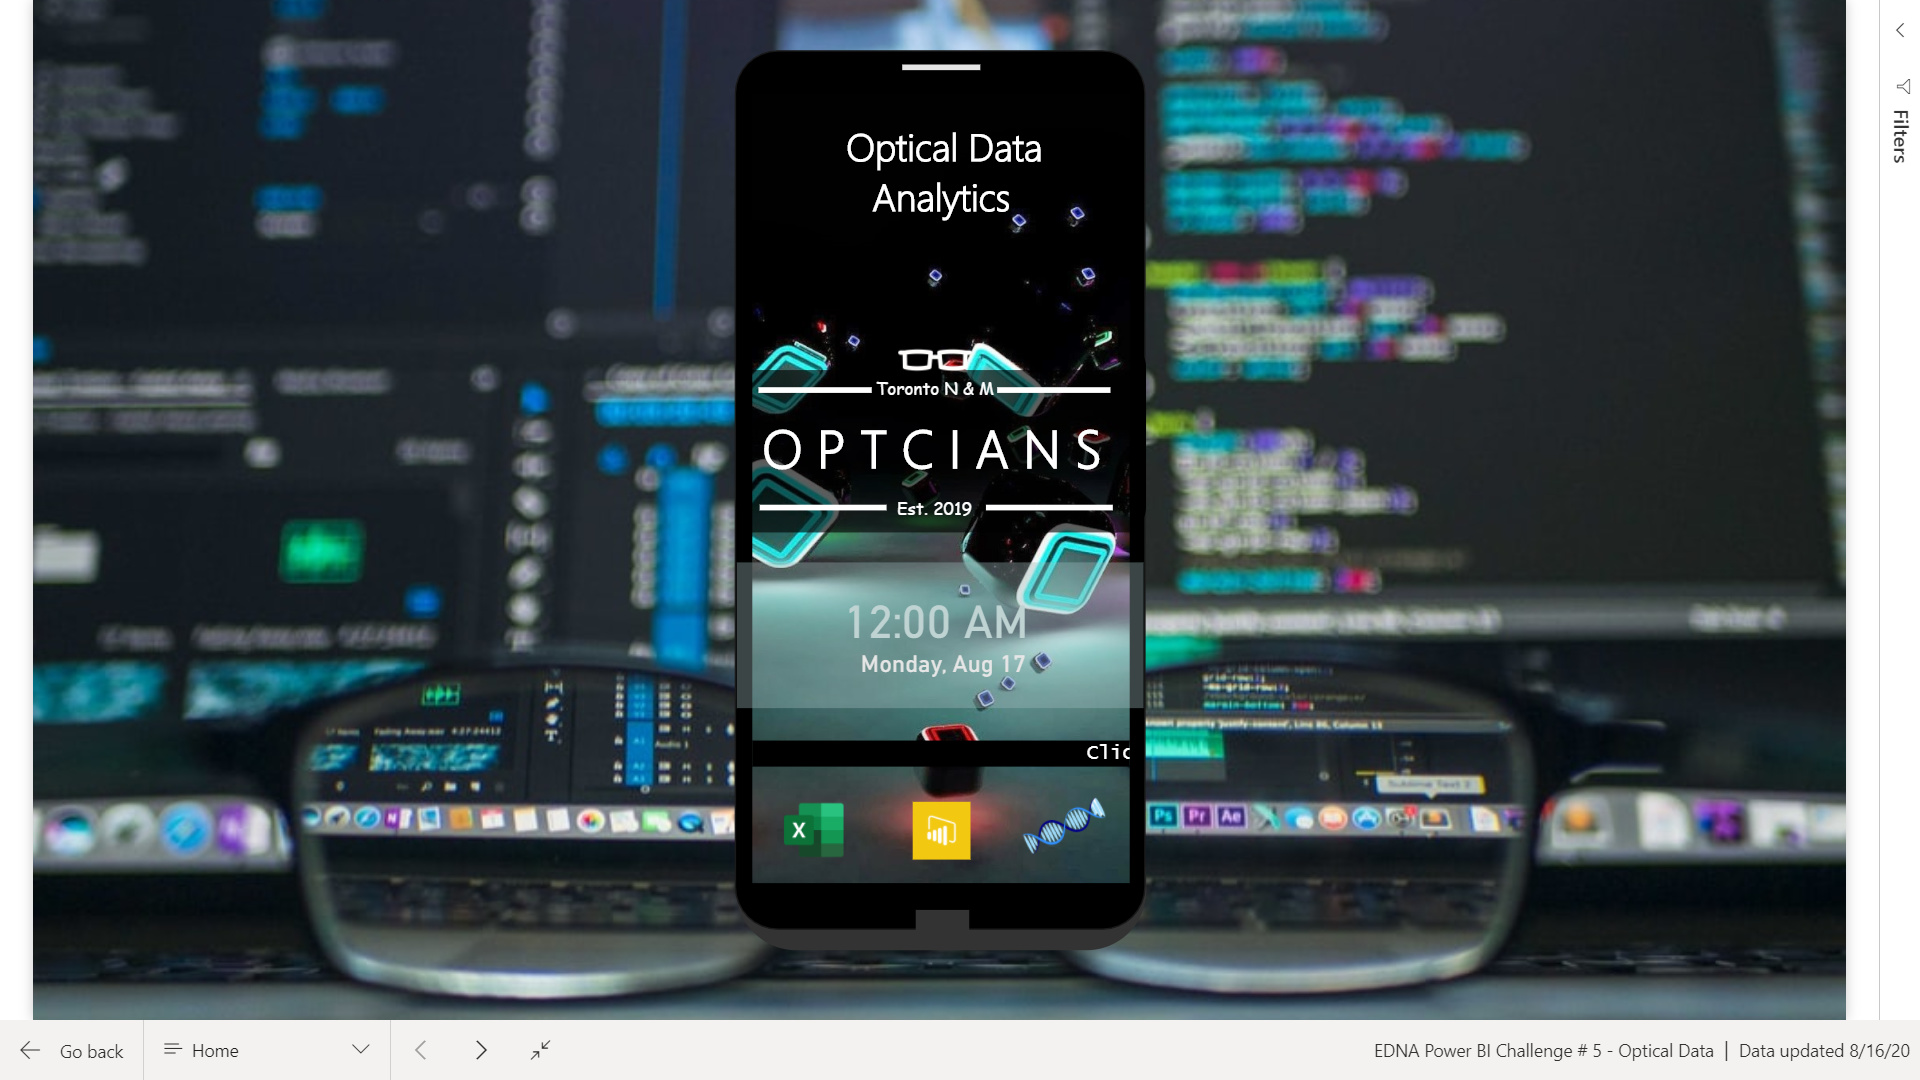
As it was mentioned that Penny & Co. aren’t tech savvy so designed a tracker inspired by mobile phone theme. Any body can use a phone right?. The report starts with welcome screen where you can see Excel, Power Bi & EDNA Icon. The reasoning behind this is if Penny wants to open the source file, she can click on excel and will update the patient details,for viewing report on Web, she will click on Power Bi Icon and for additional instructions to include in the report, pointers will be updated on the company’s shared server.
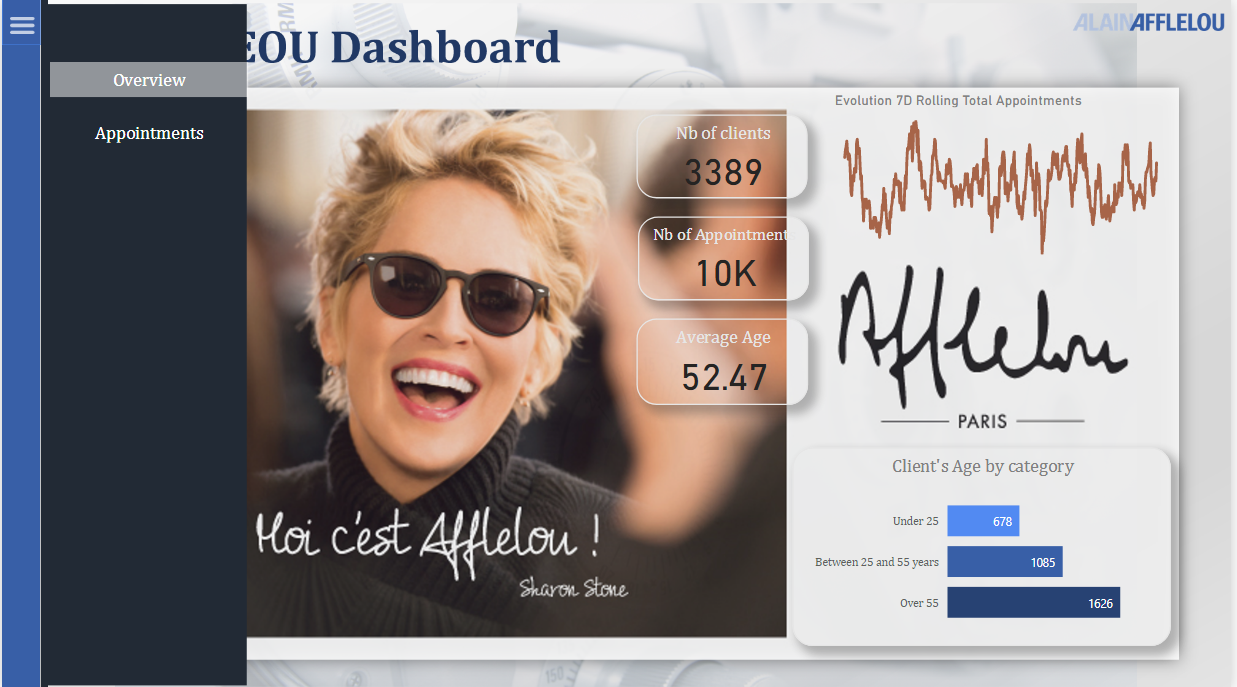
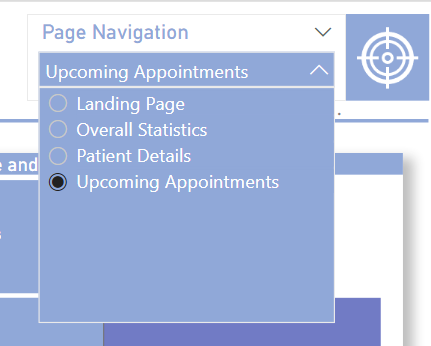
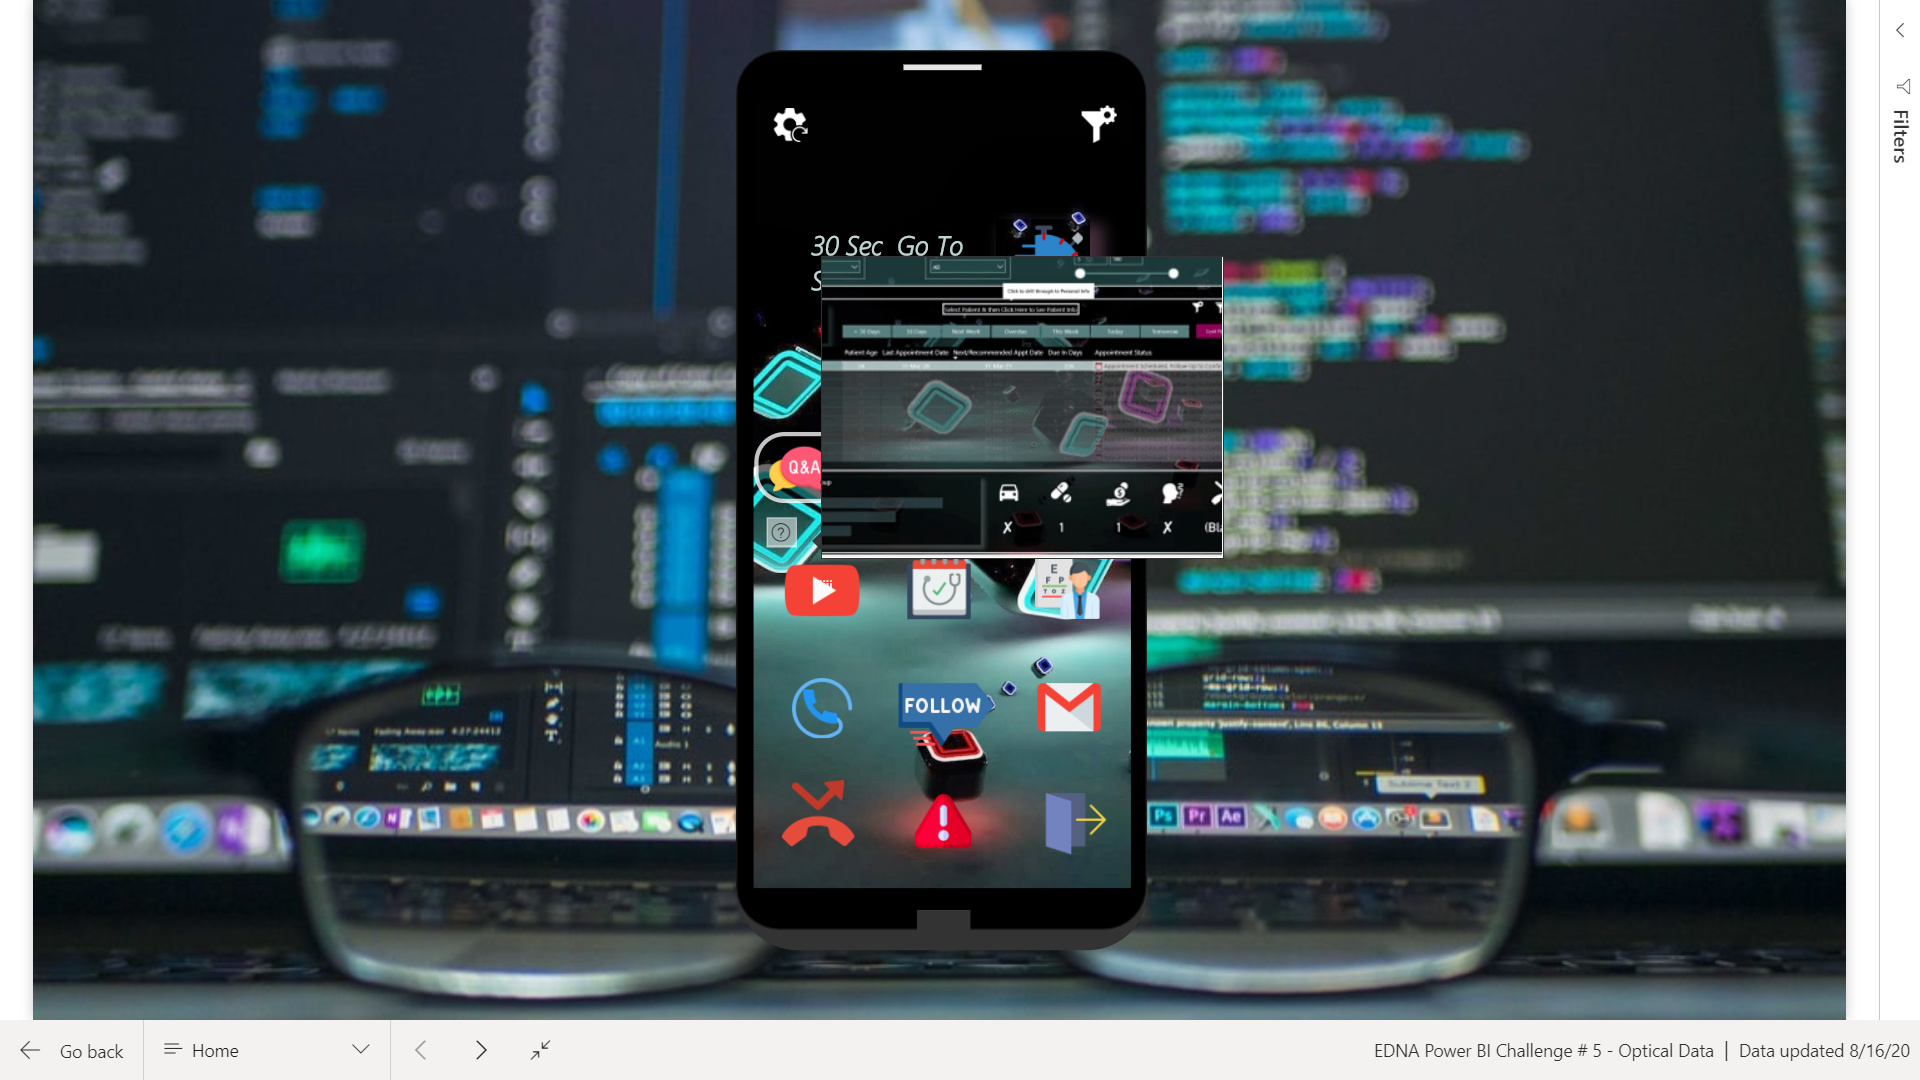
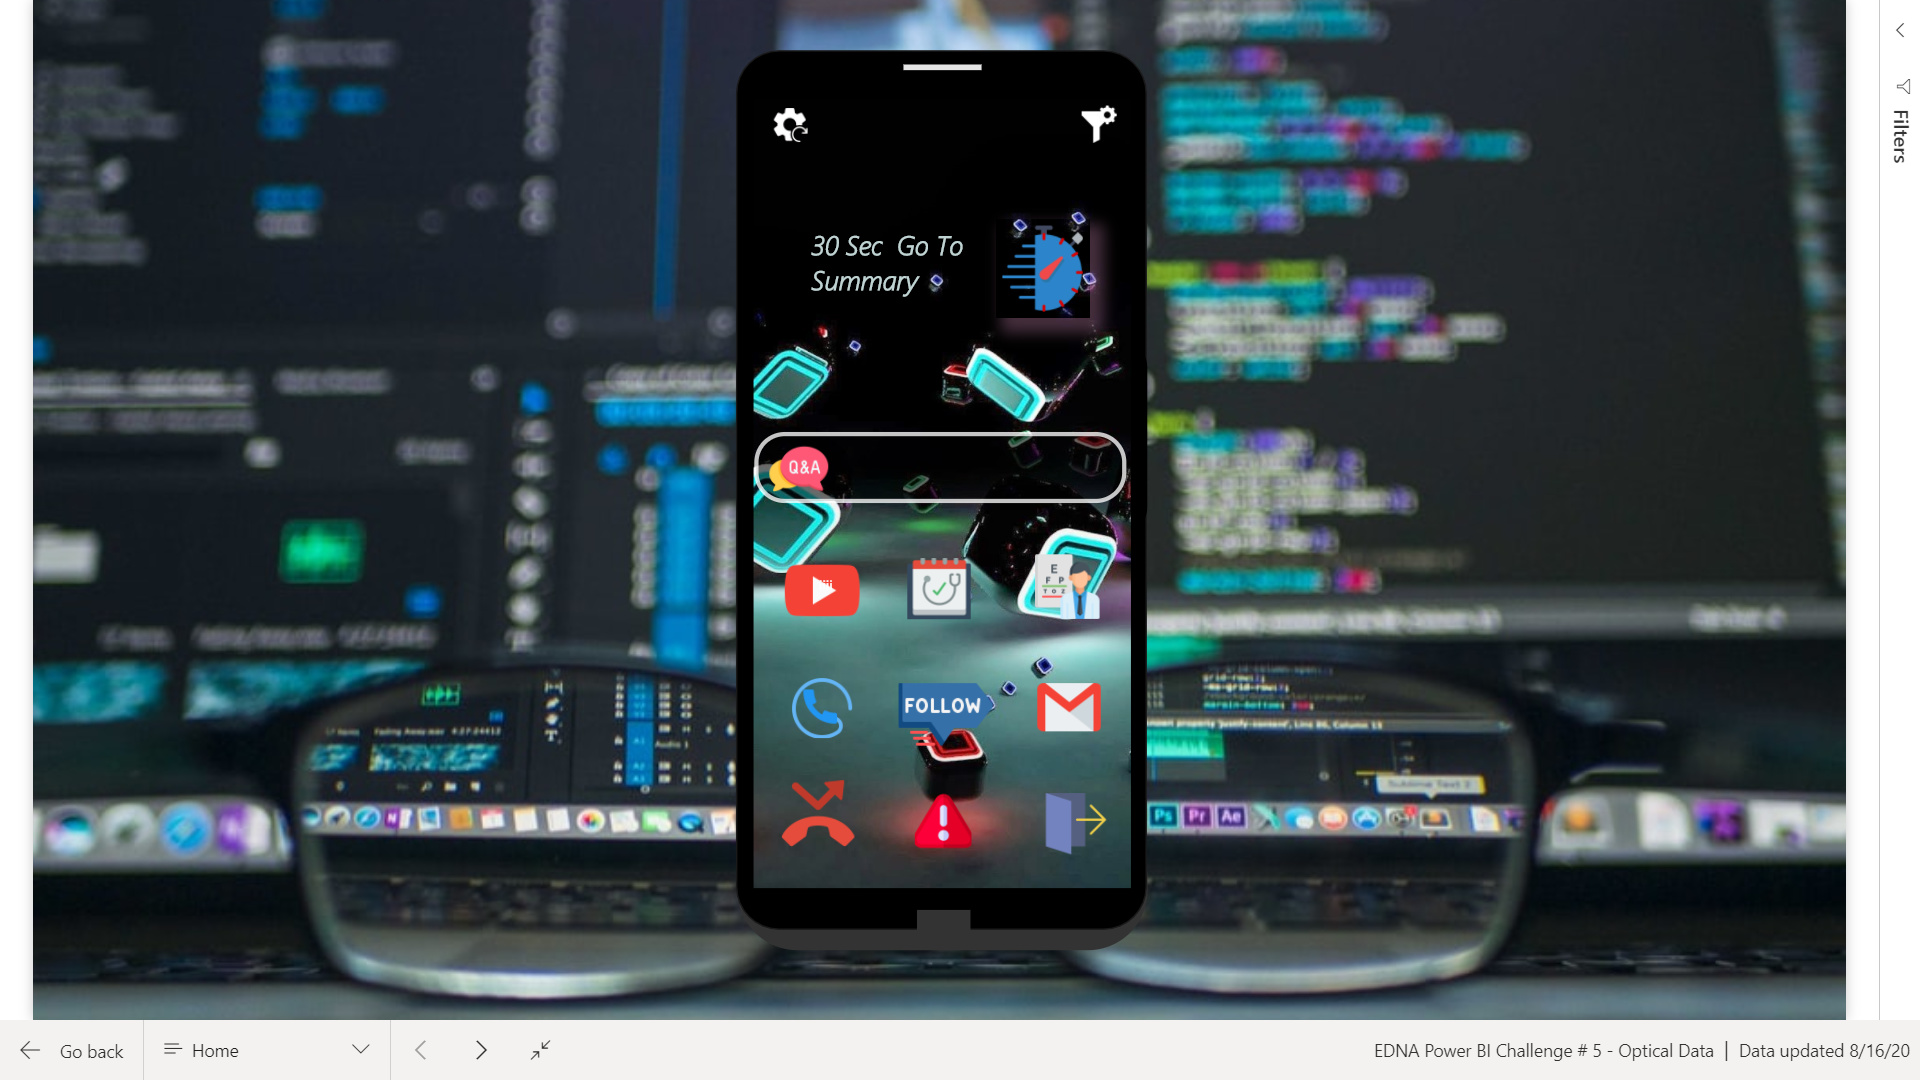
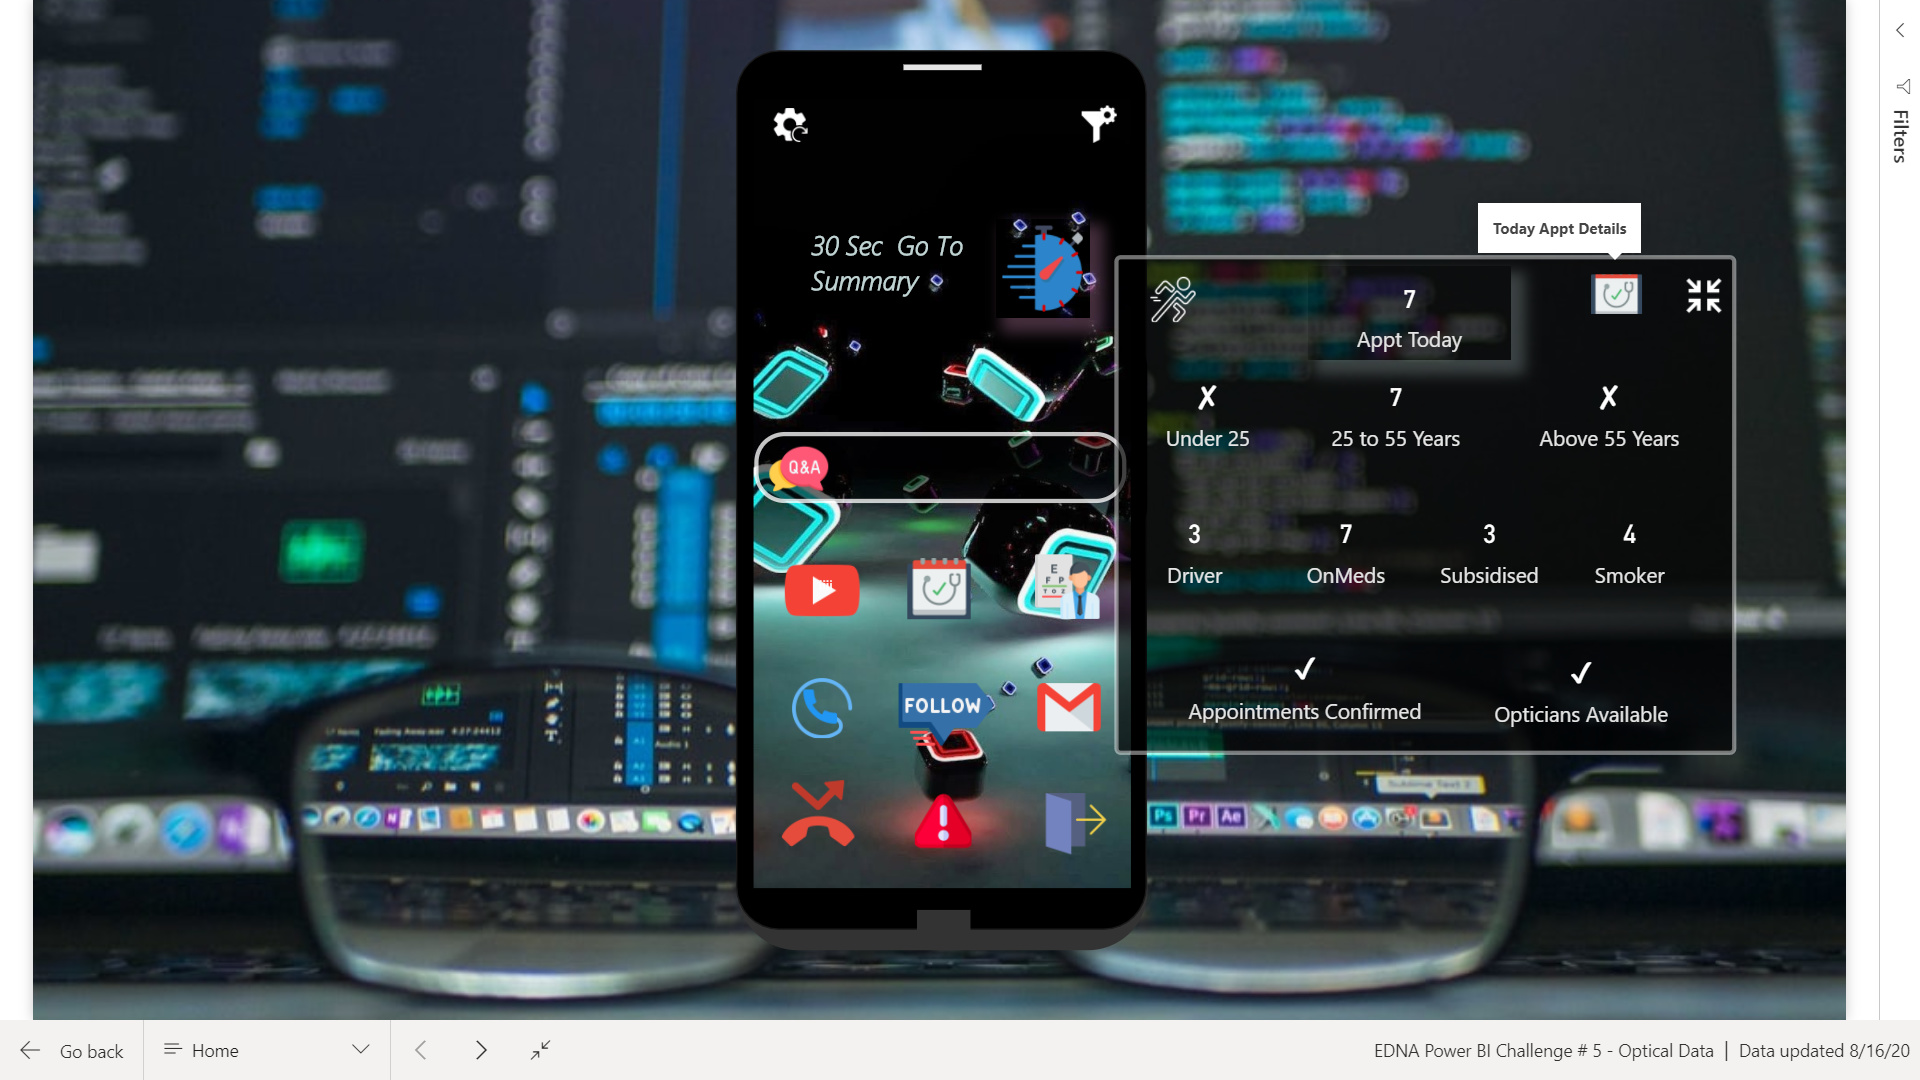
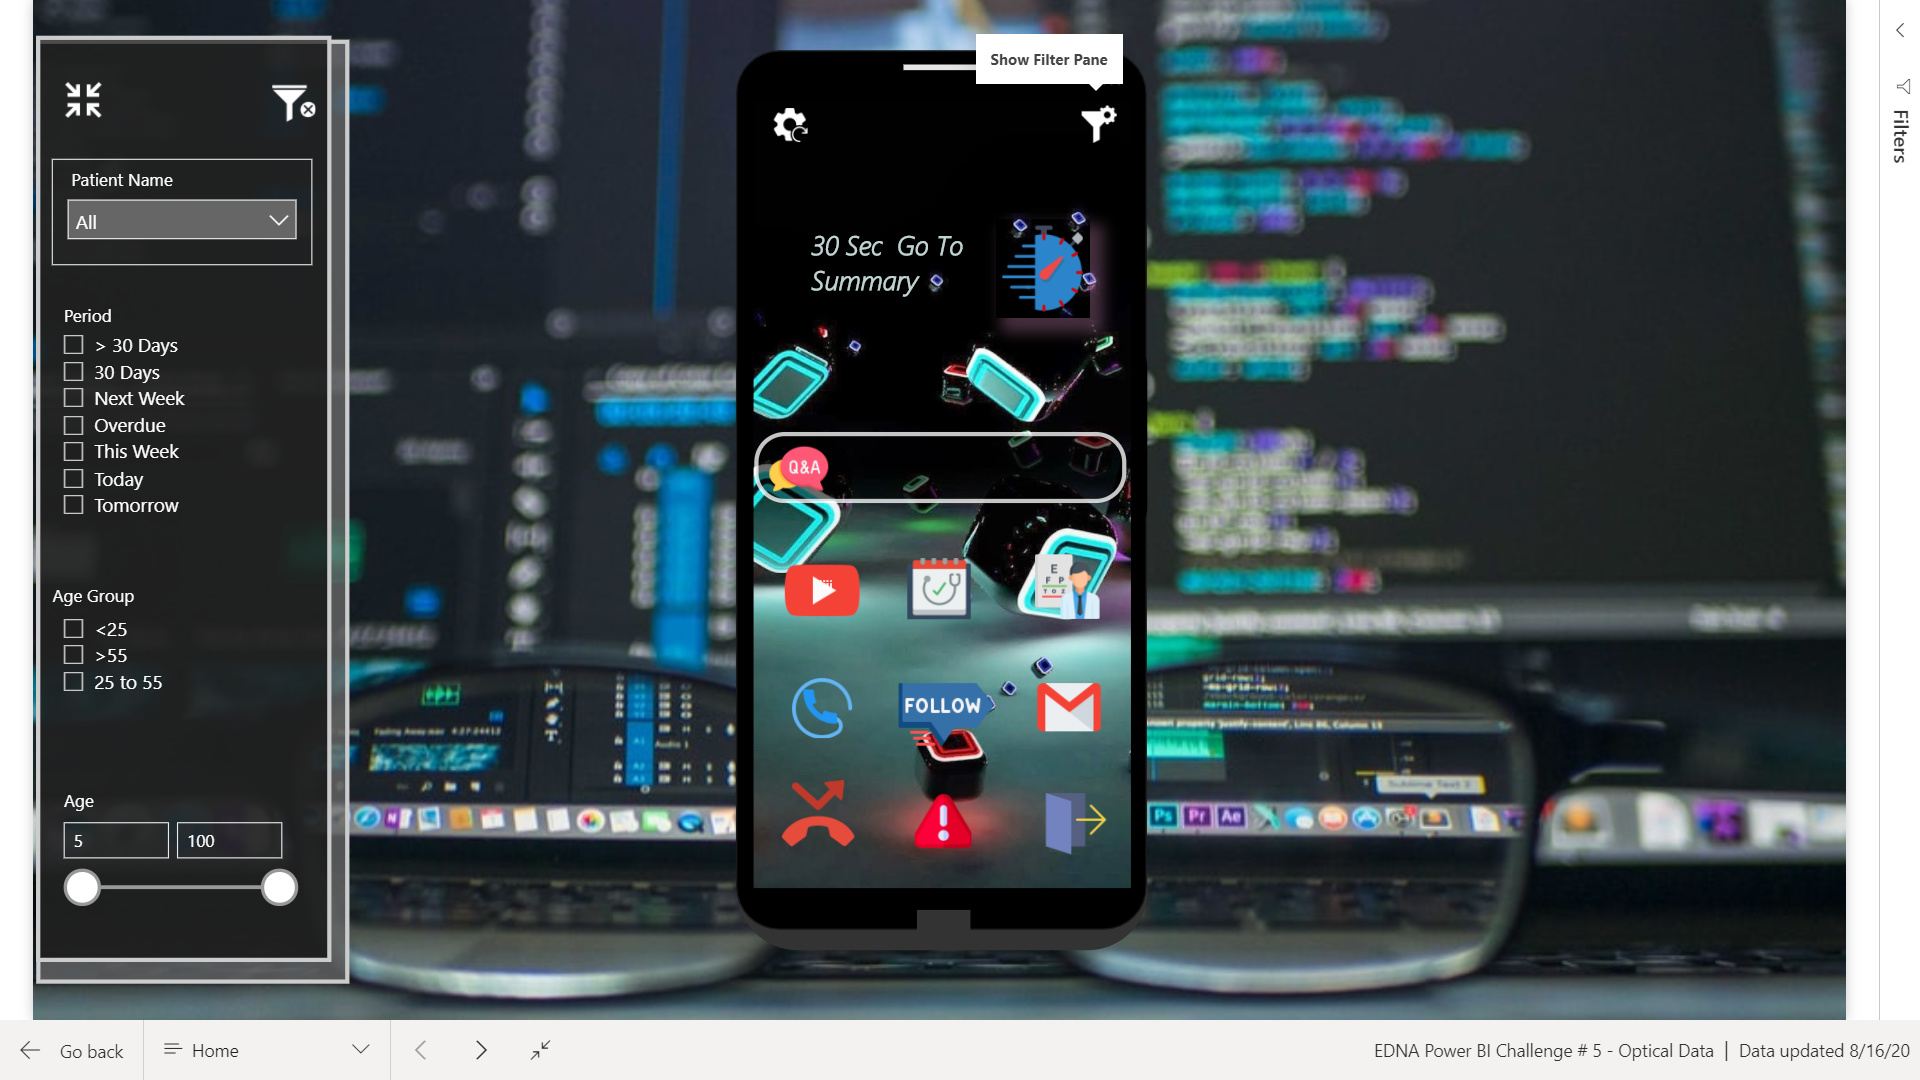
To Log in, click on the scroller, which will take you to Menu Page, which is designed as mobile phone with different menus. If opticians are busy and want a quick overview, they will click on Q&A icon and on 30 Sec Go to Summary Icon. For other details, choose different menus on the phone.
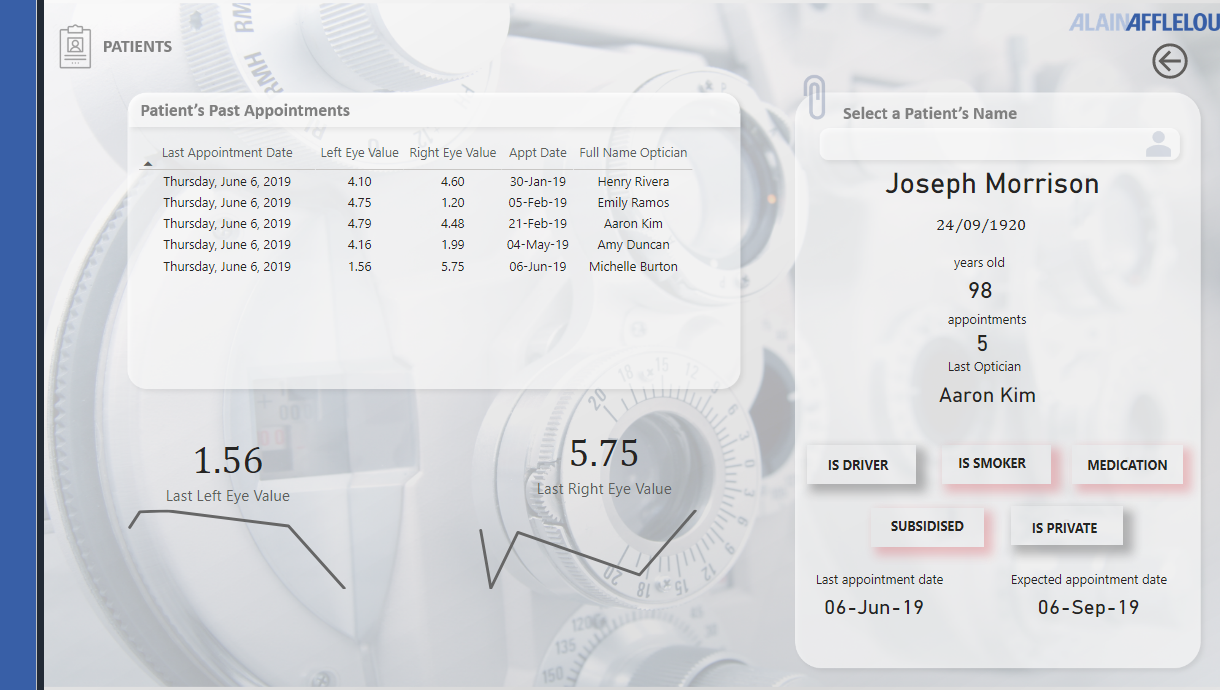
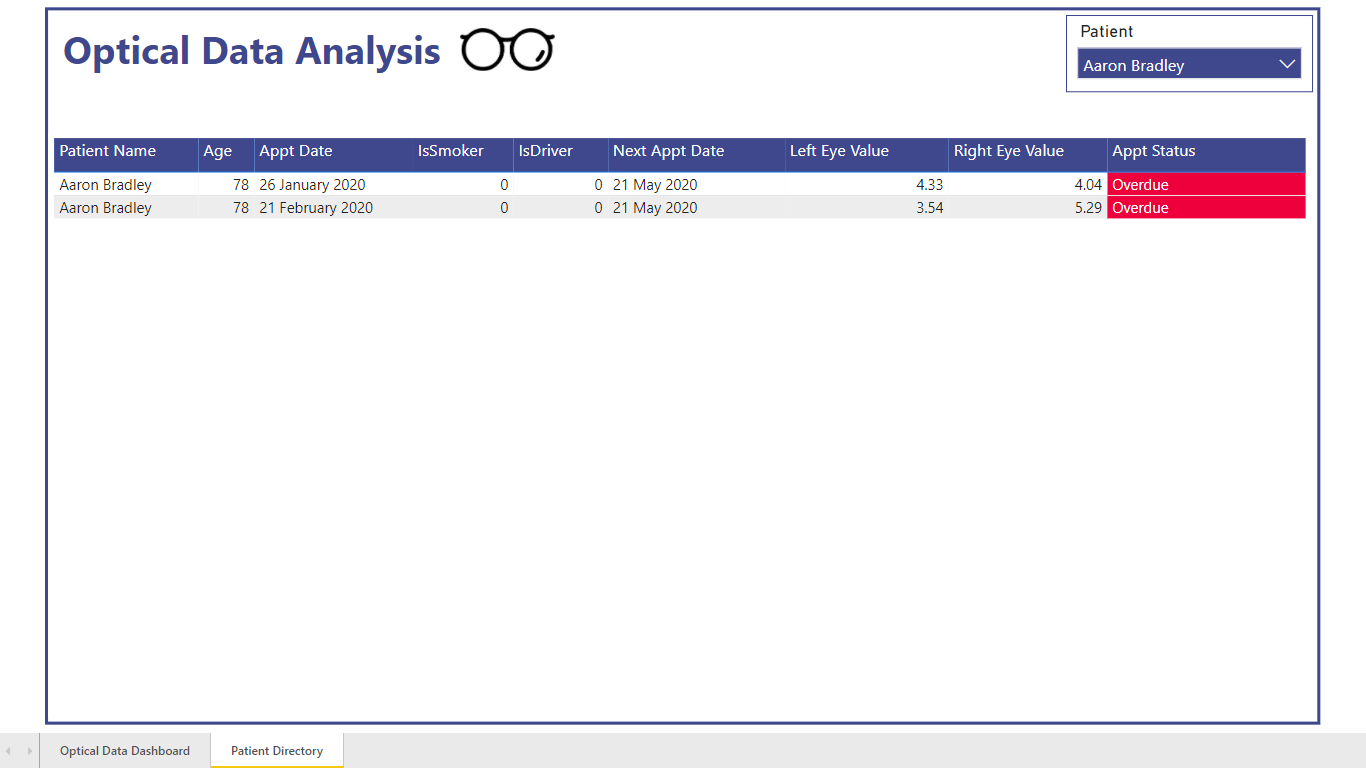
To see how to drill-through on the report, check Youtube icon. In my report I have shown 3 different ways to drill-through. I wanted to add the 4th option but for that I had to publish my report to web. However, it is not permitted by admin. With the 4th option, Penny can click on the patient name and all the details will show for that patient. Following is the link for that trick:
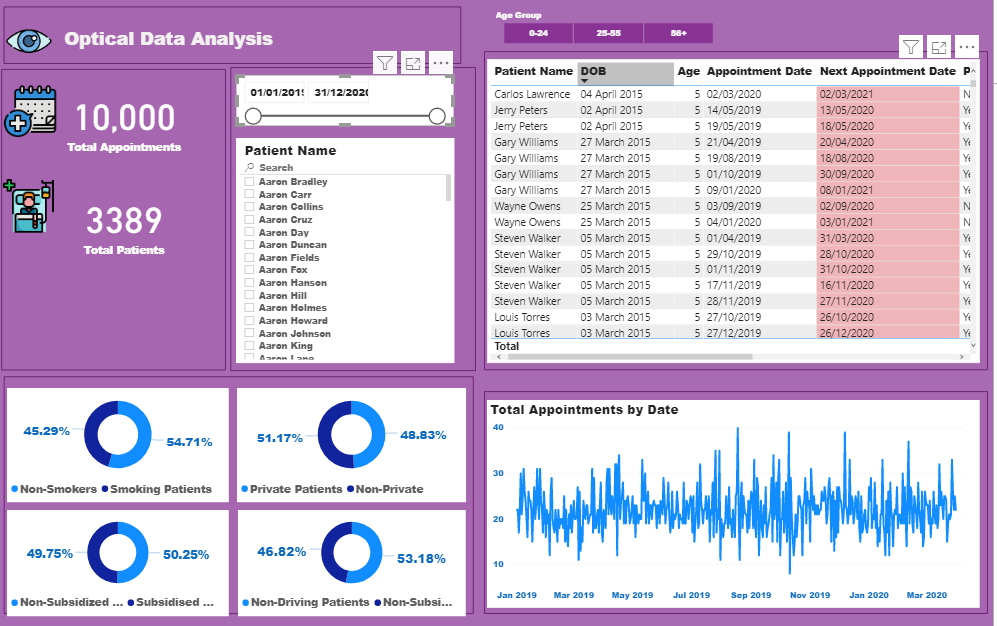
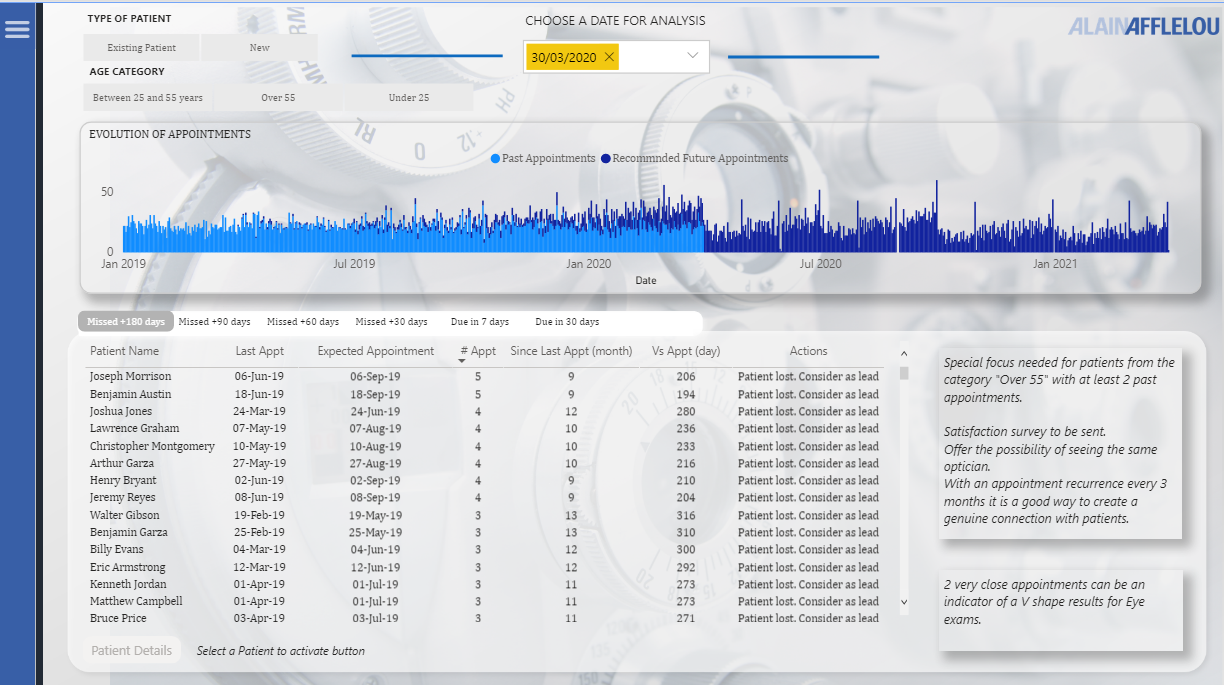
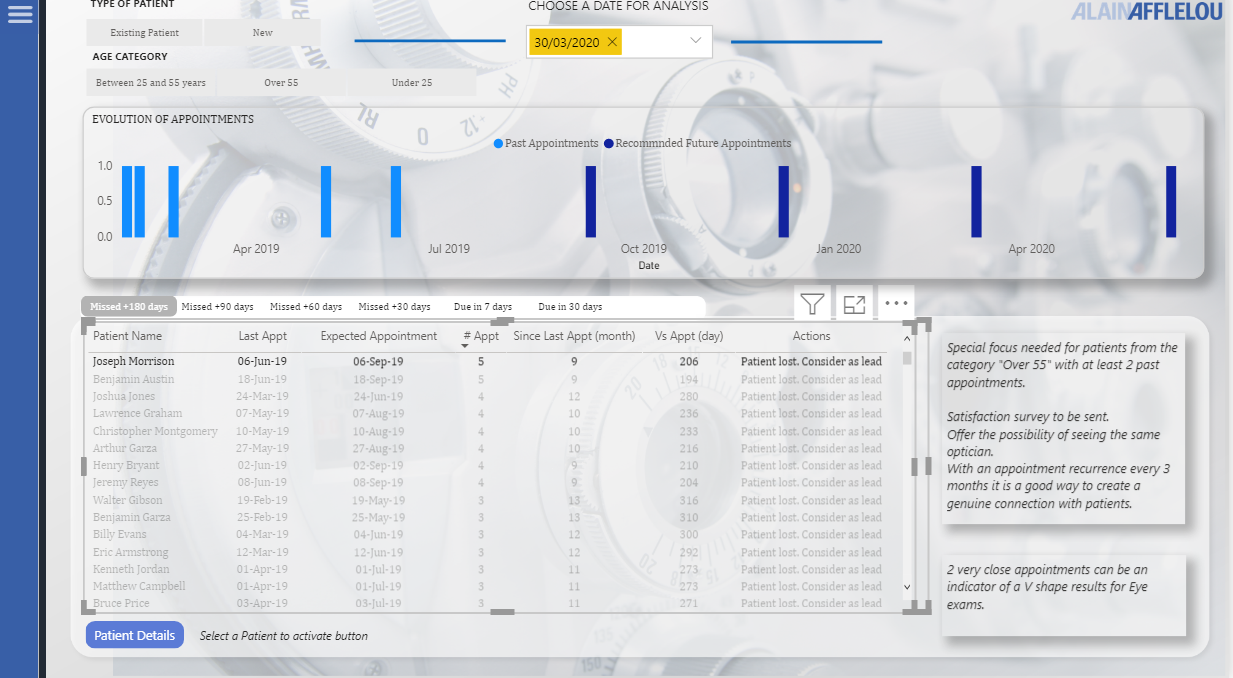
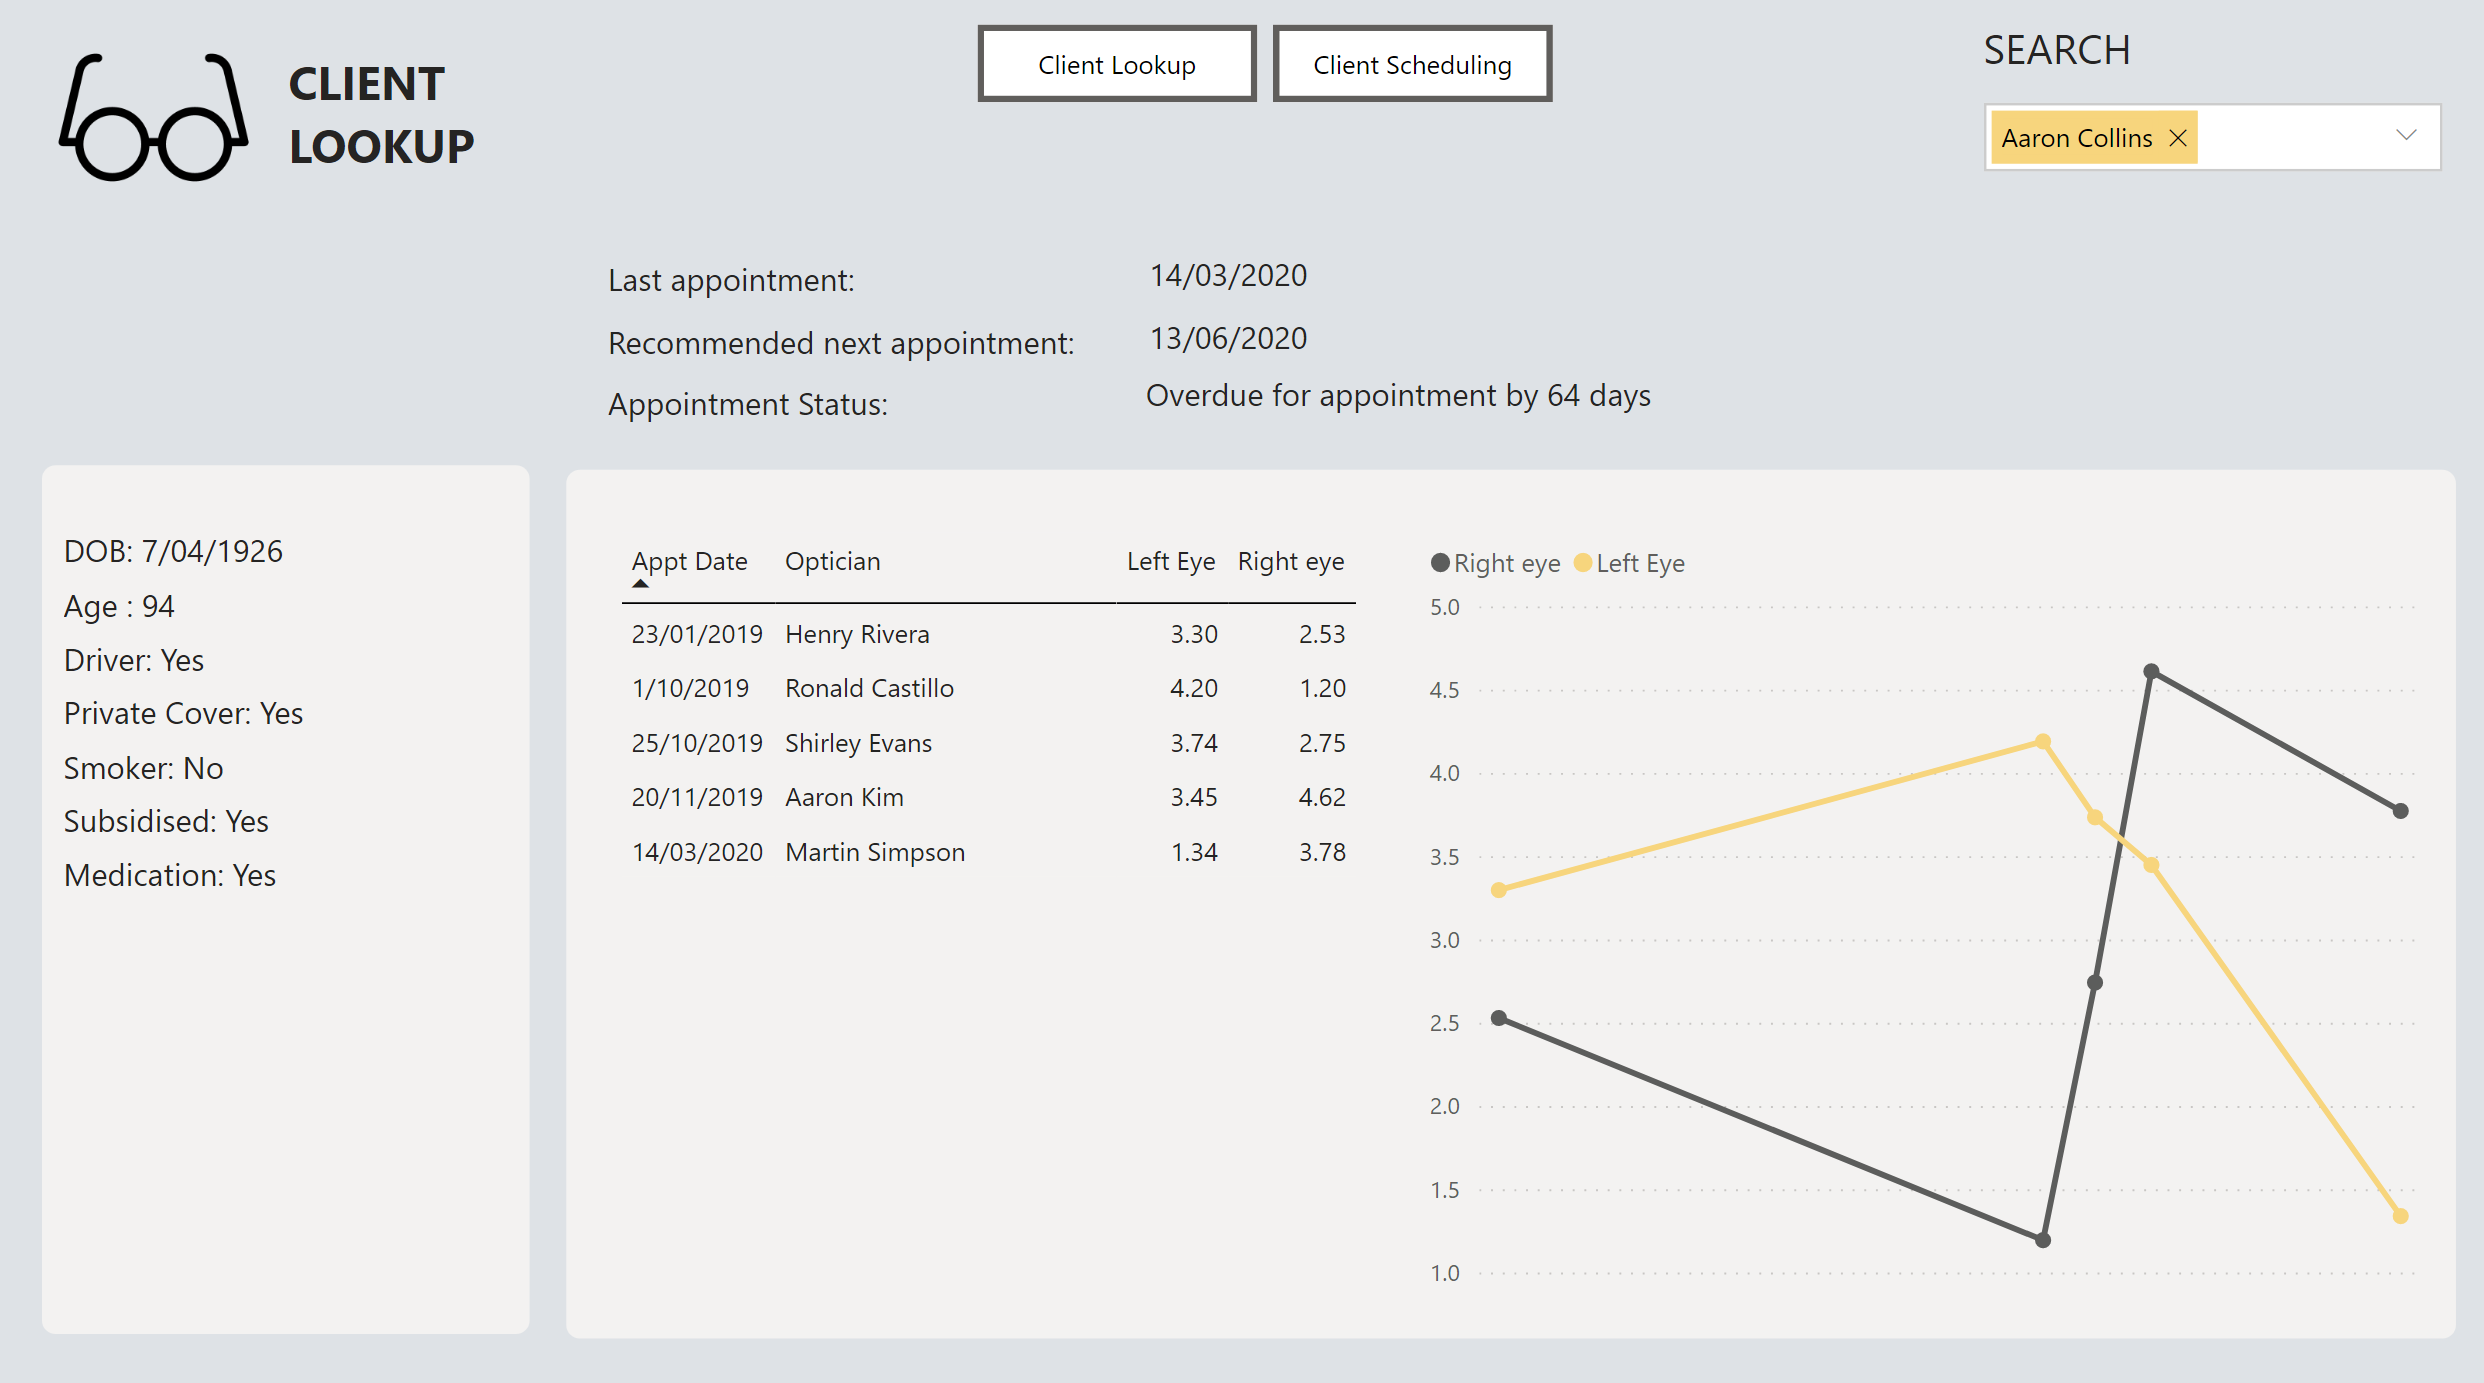
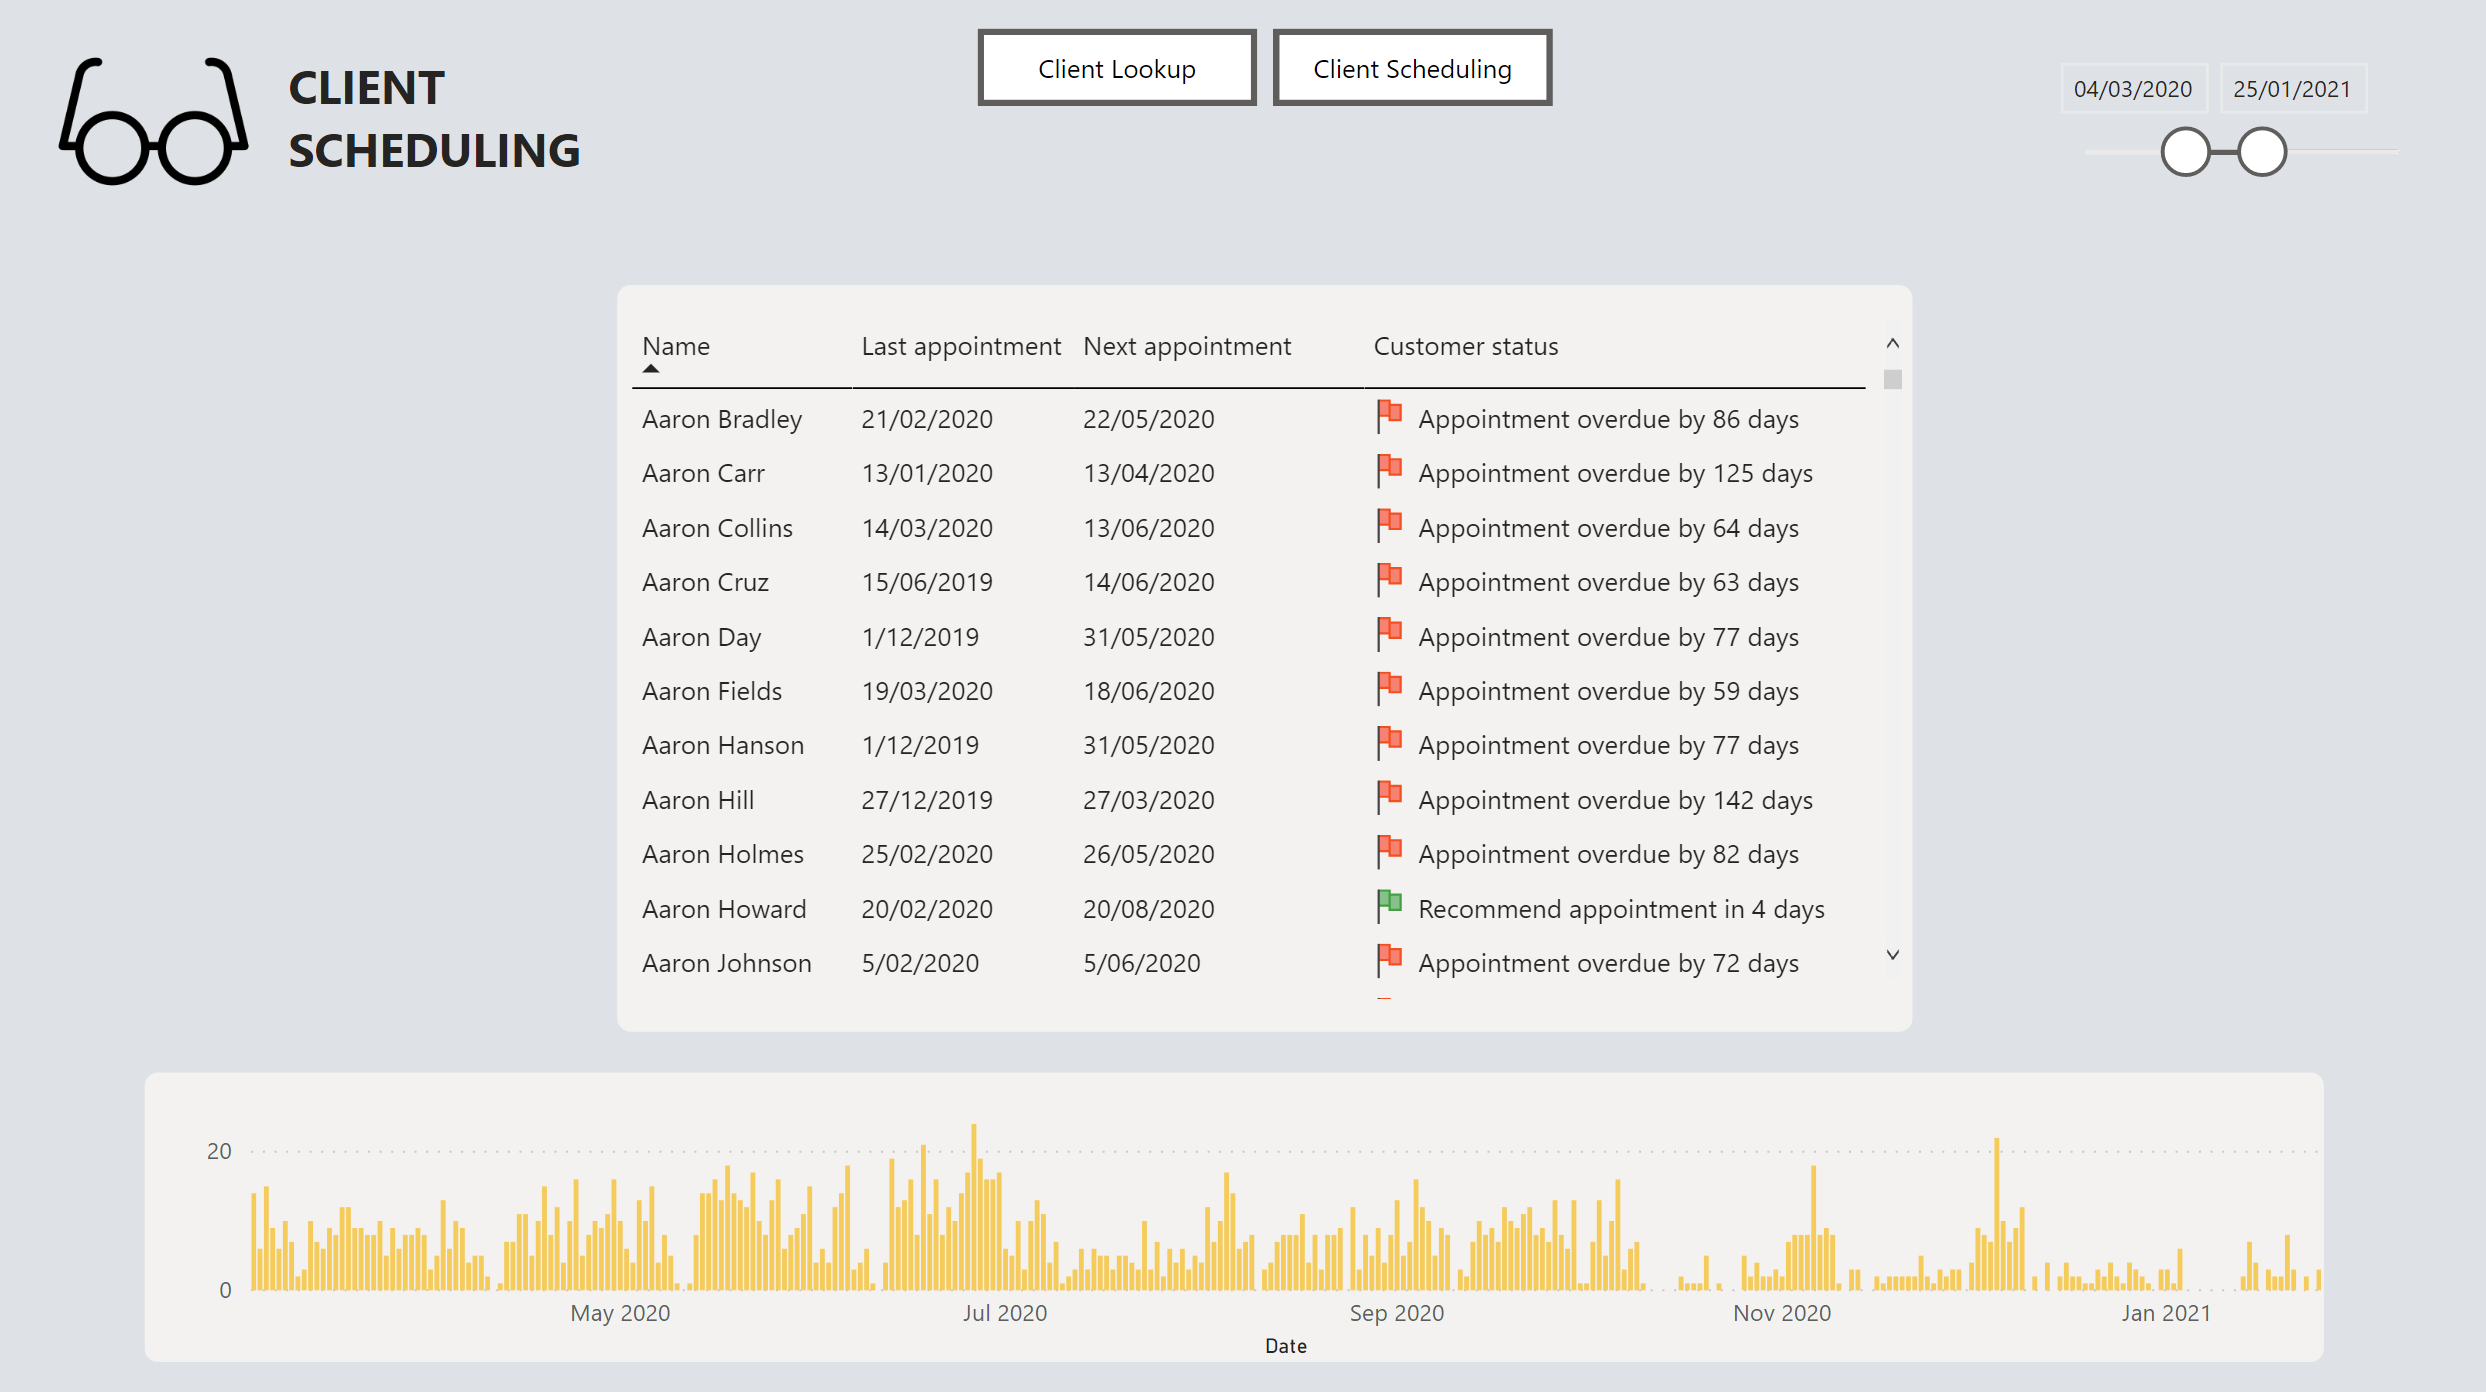
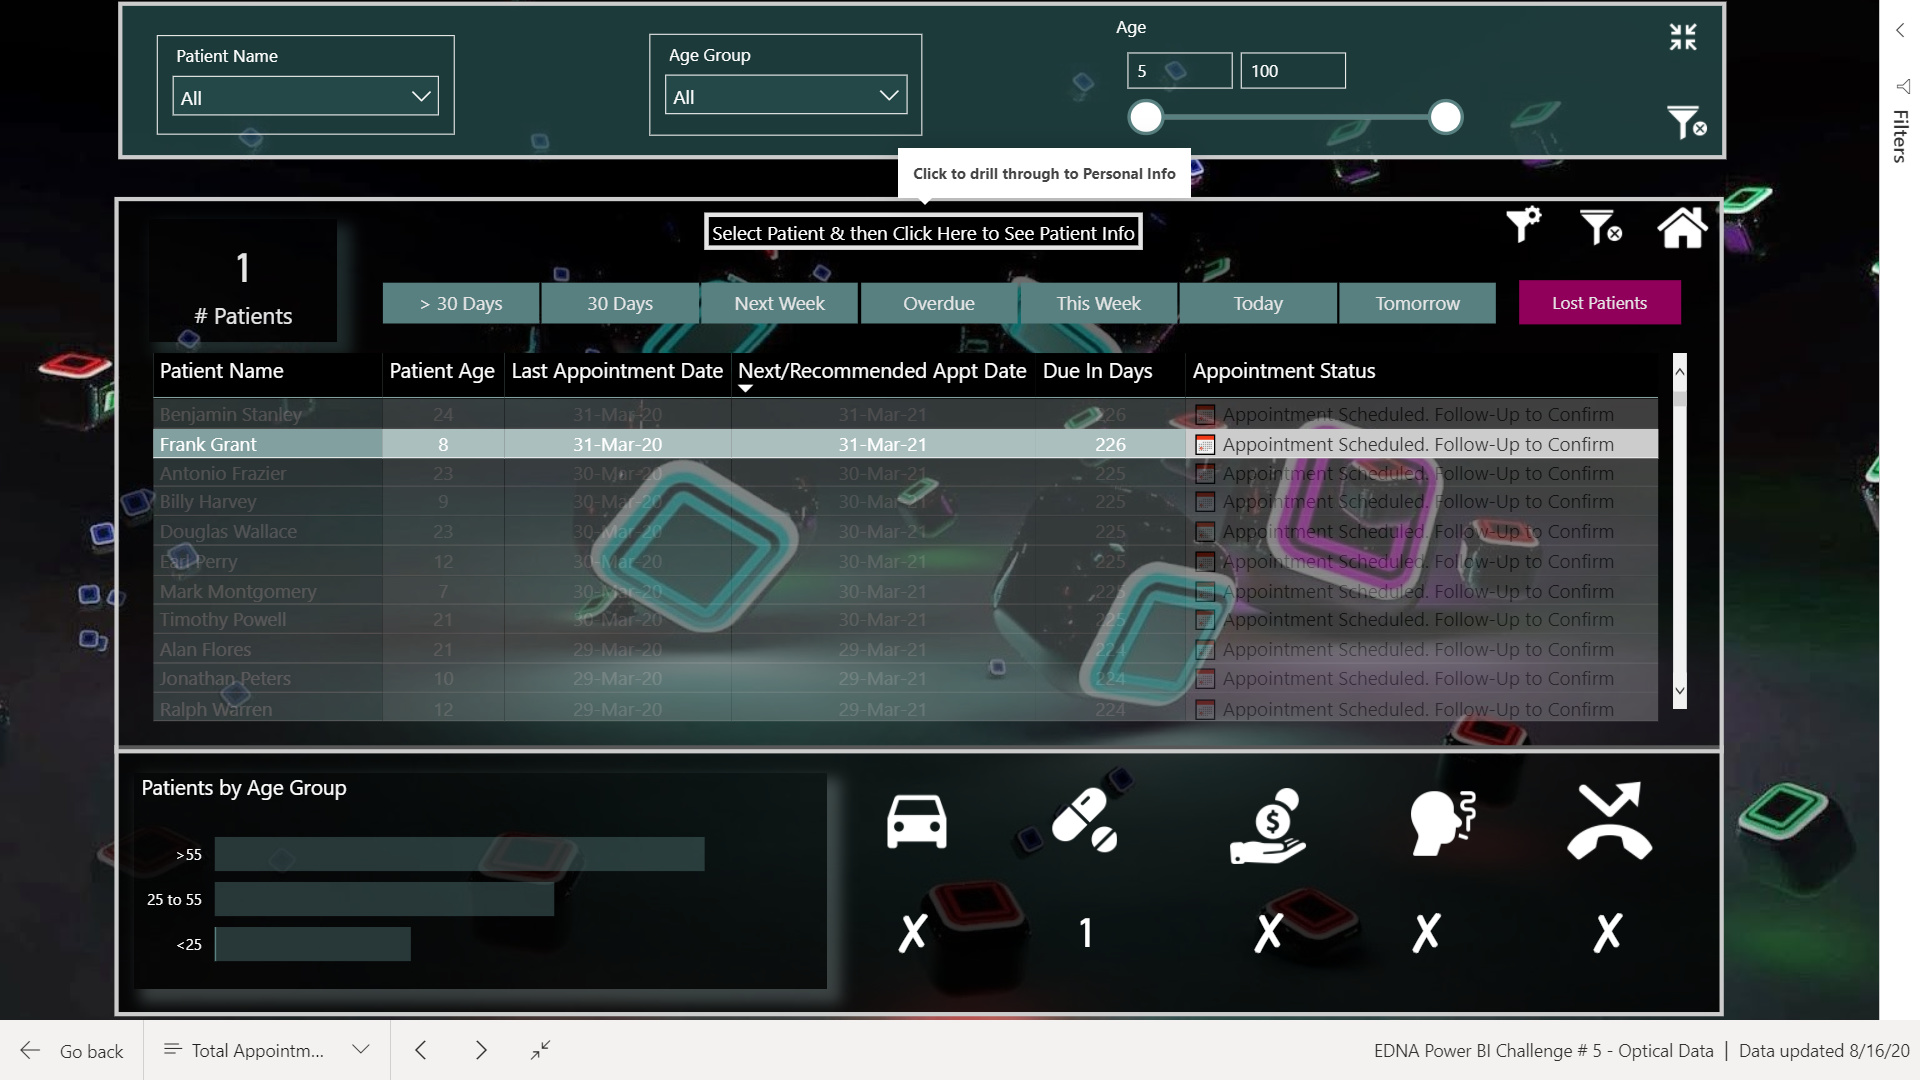
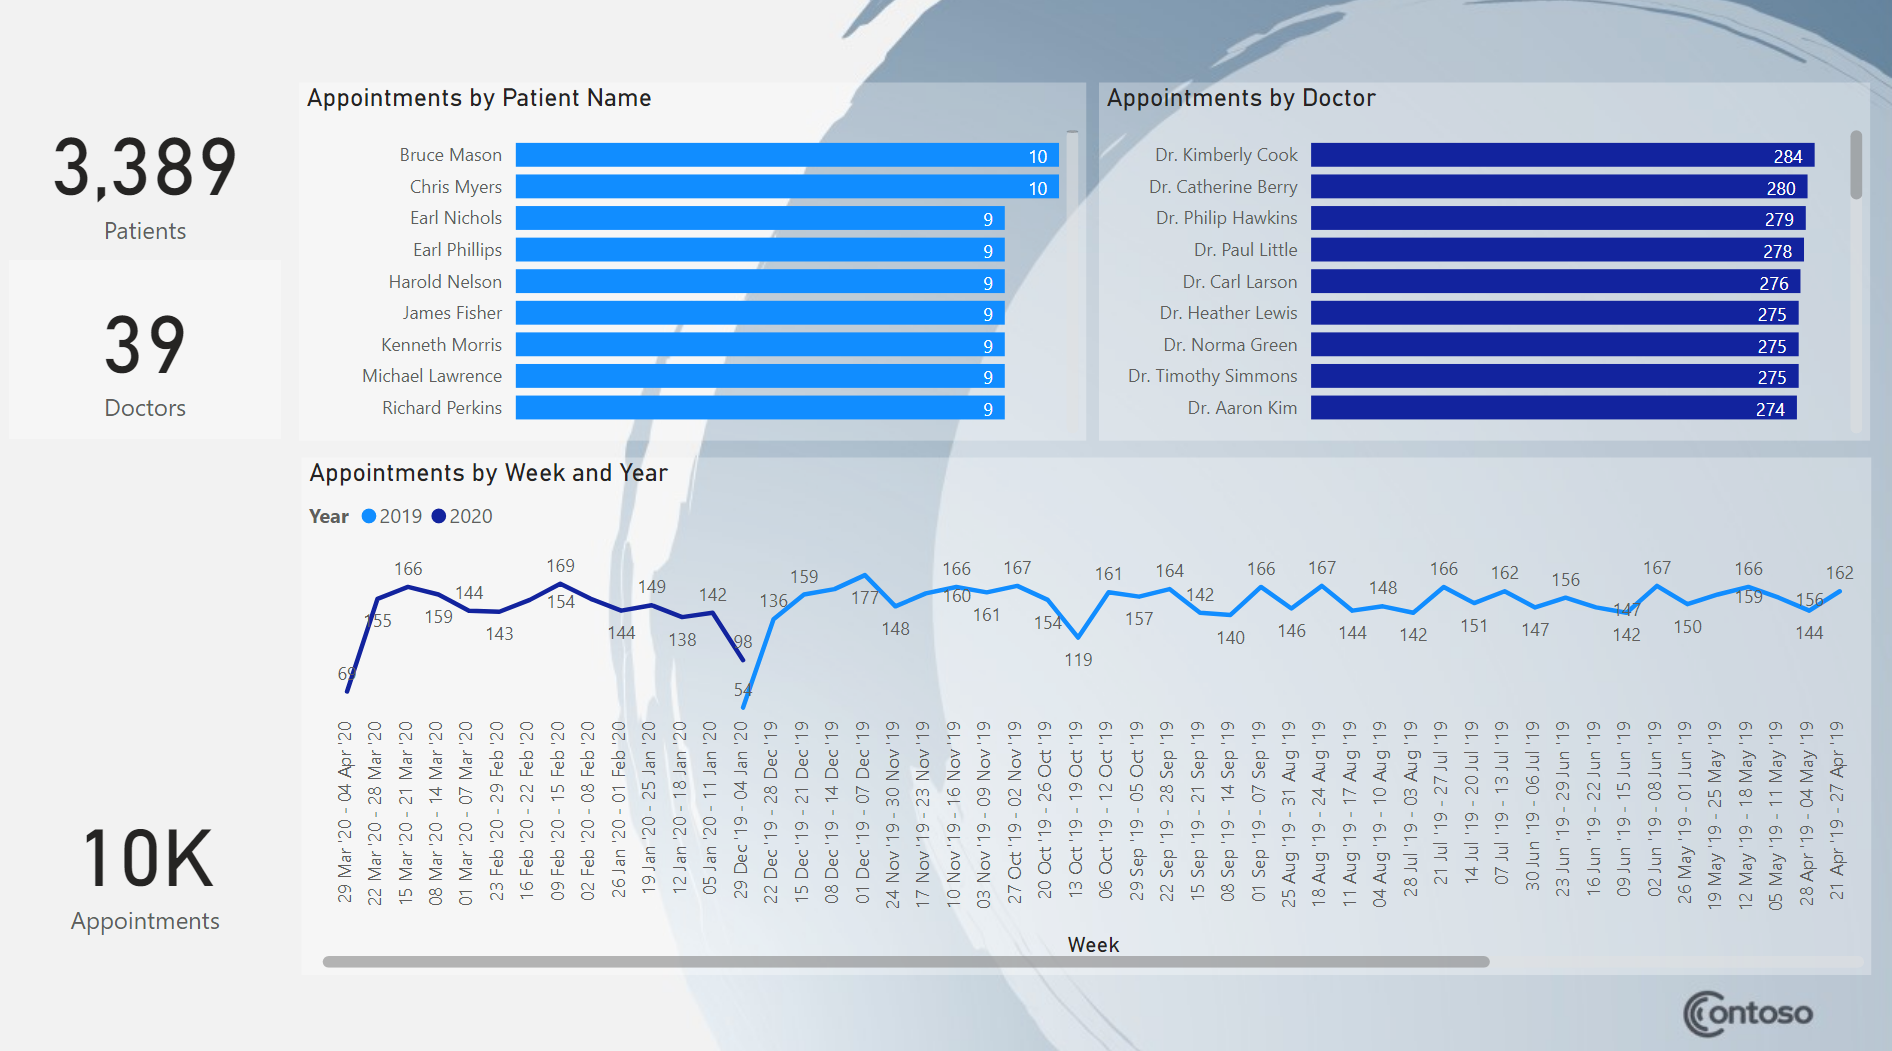
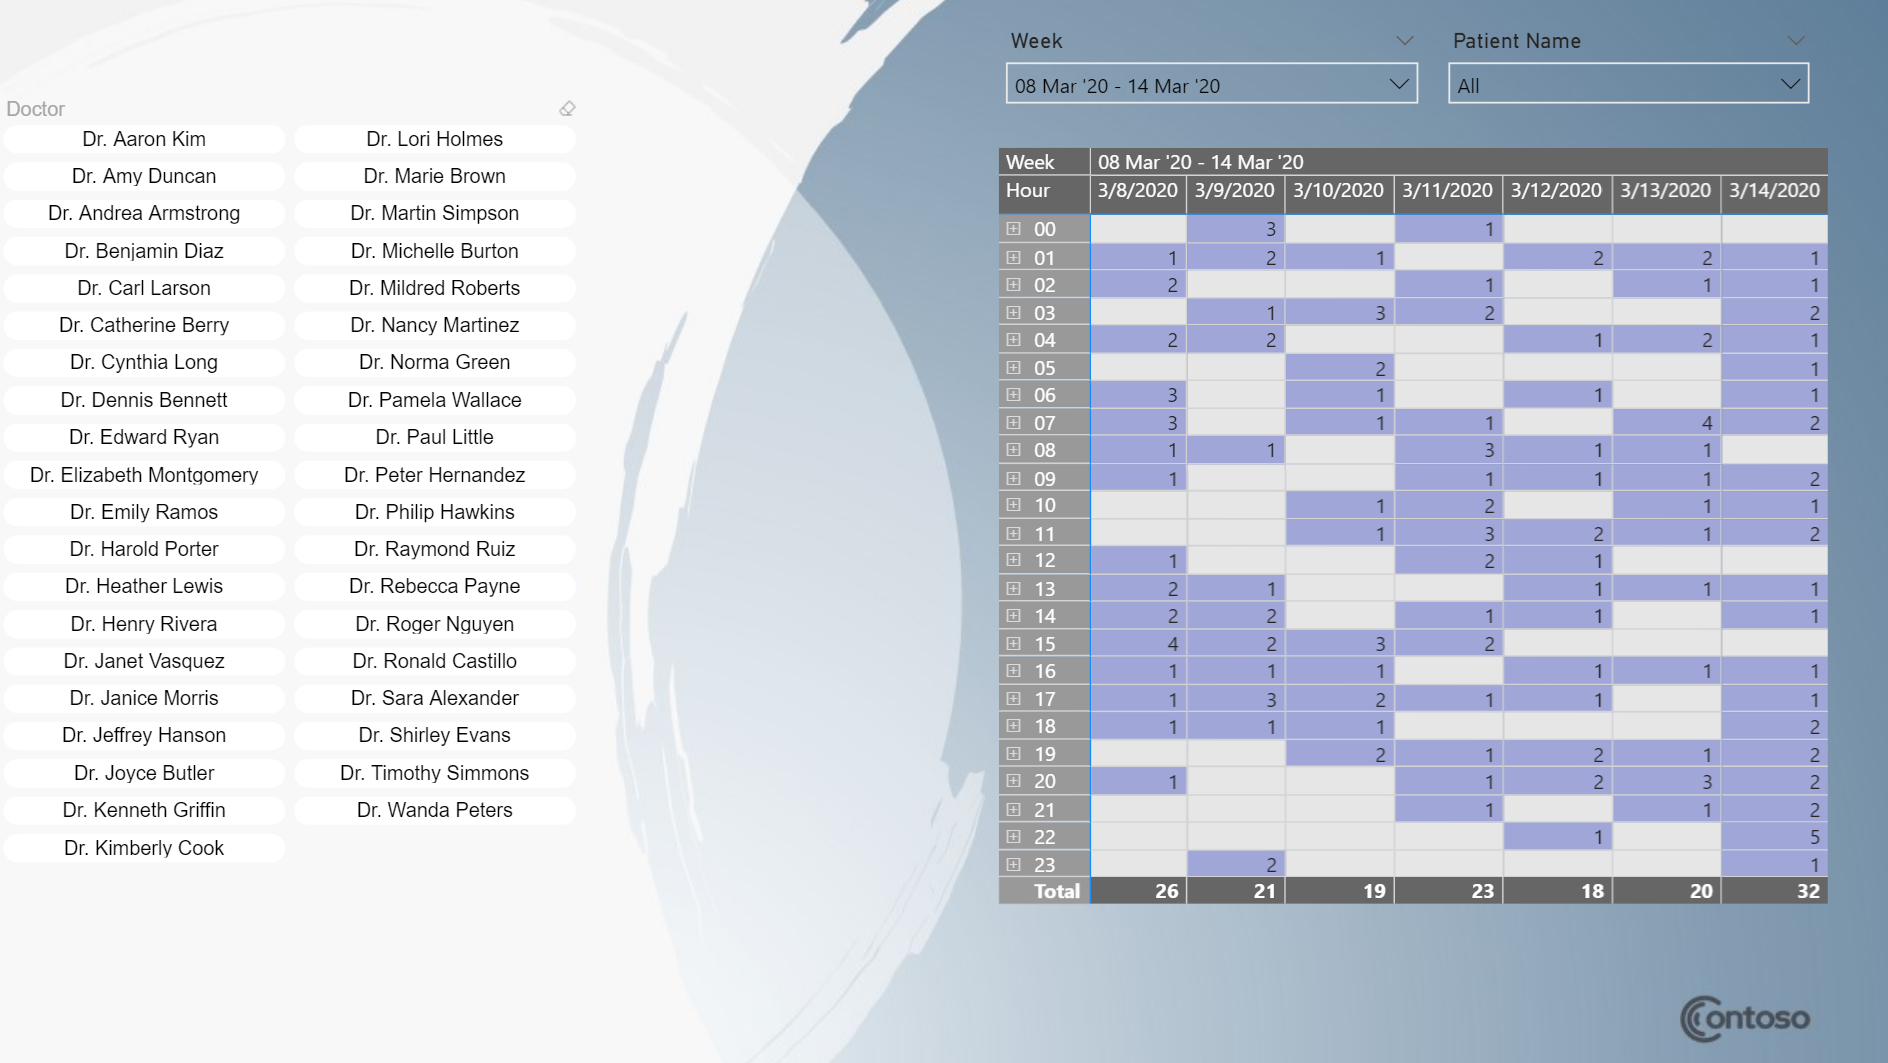
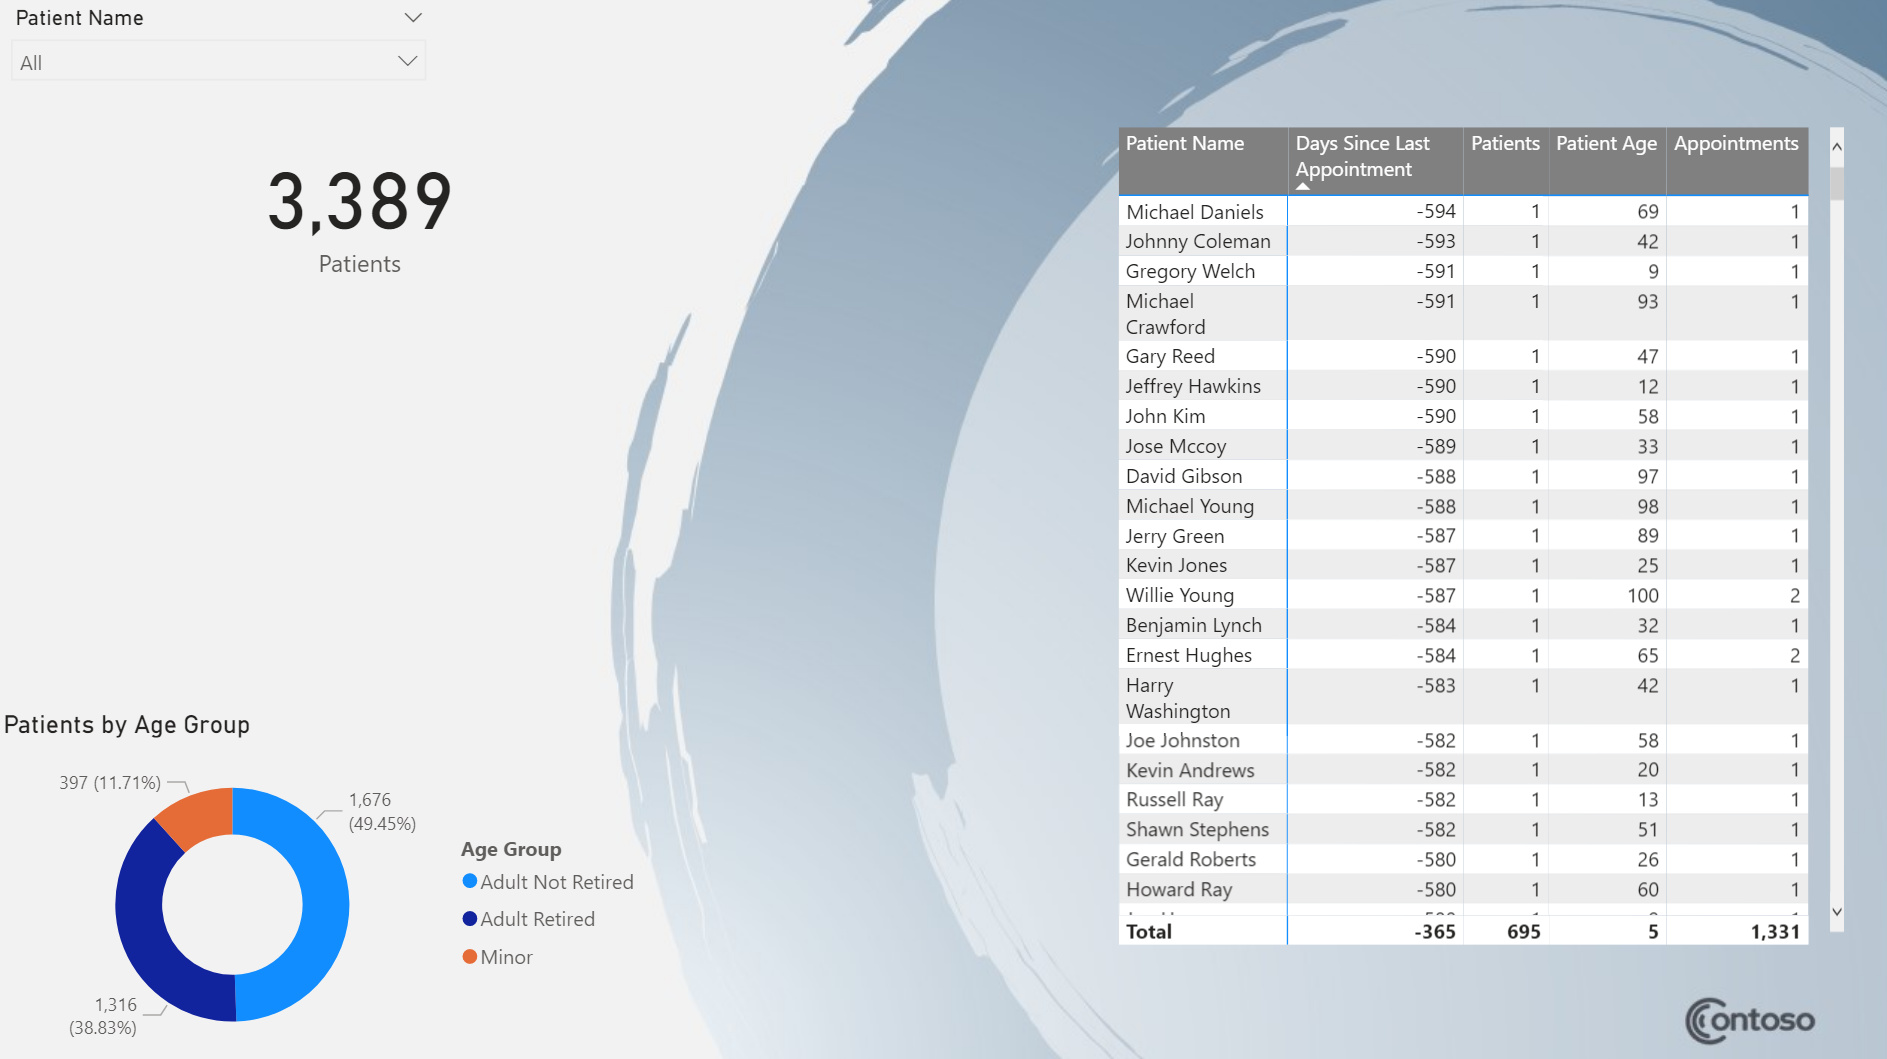
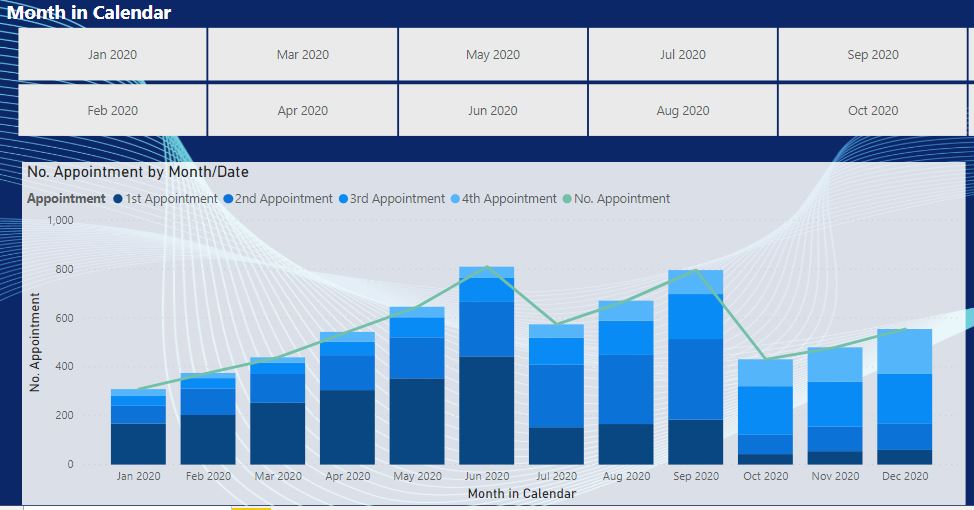
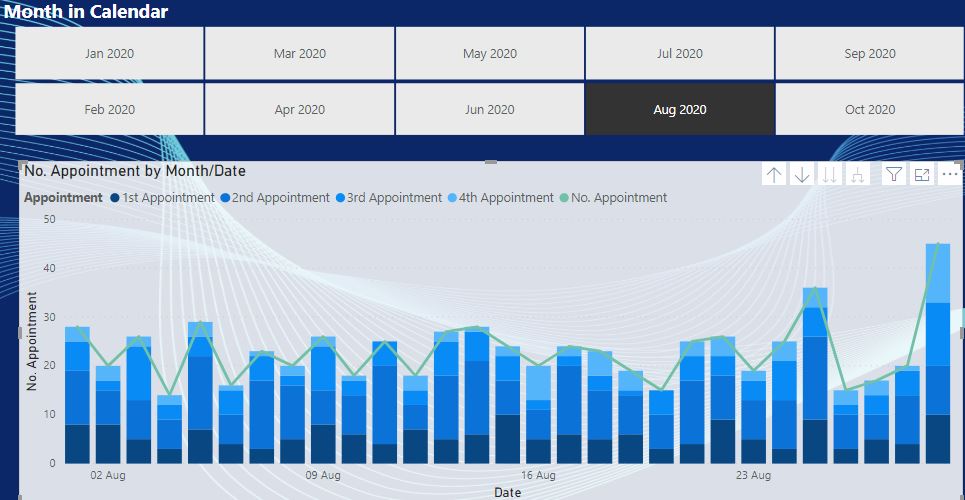
For appointment details, click on appointment icon and it will take you to next page where data can be filtered as per the requirement. To make it easier, I added icons like Gmail,Call, Red alert where data is already in its filtered state. For e.g. to see the lost patients, going to the appointment icon and then filtering it is not required, click on the red alert icon and the filtered data will pop up.
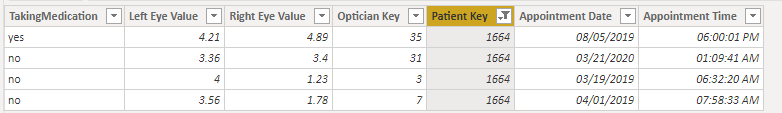
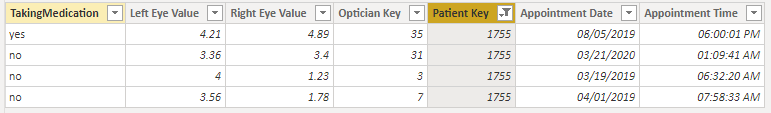
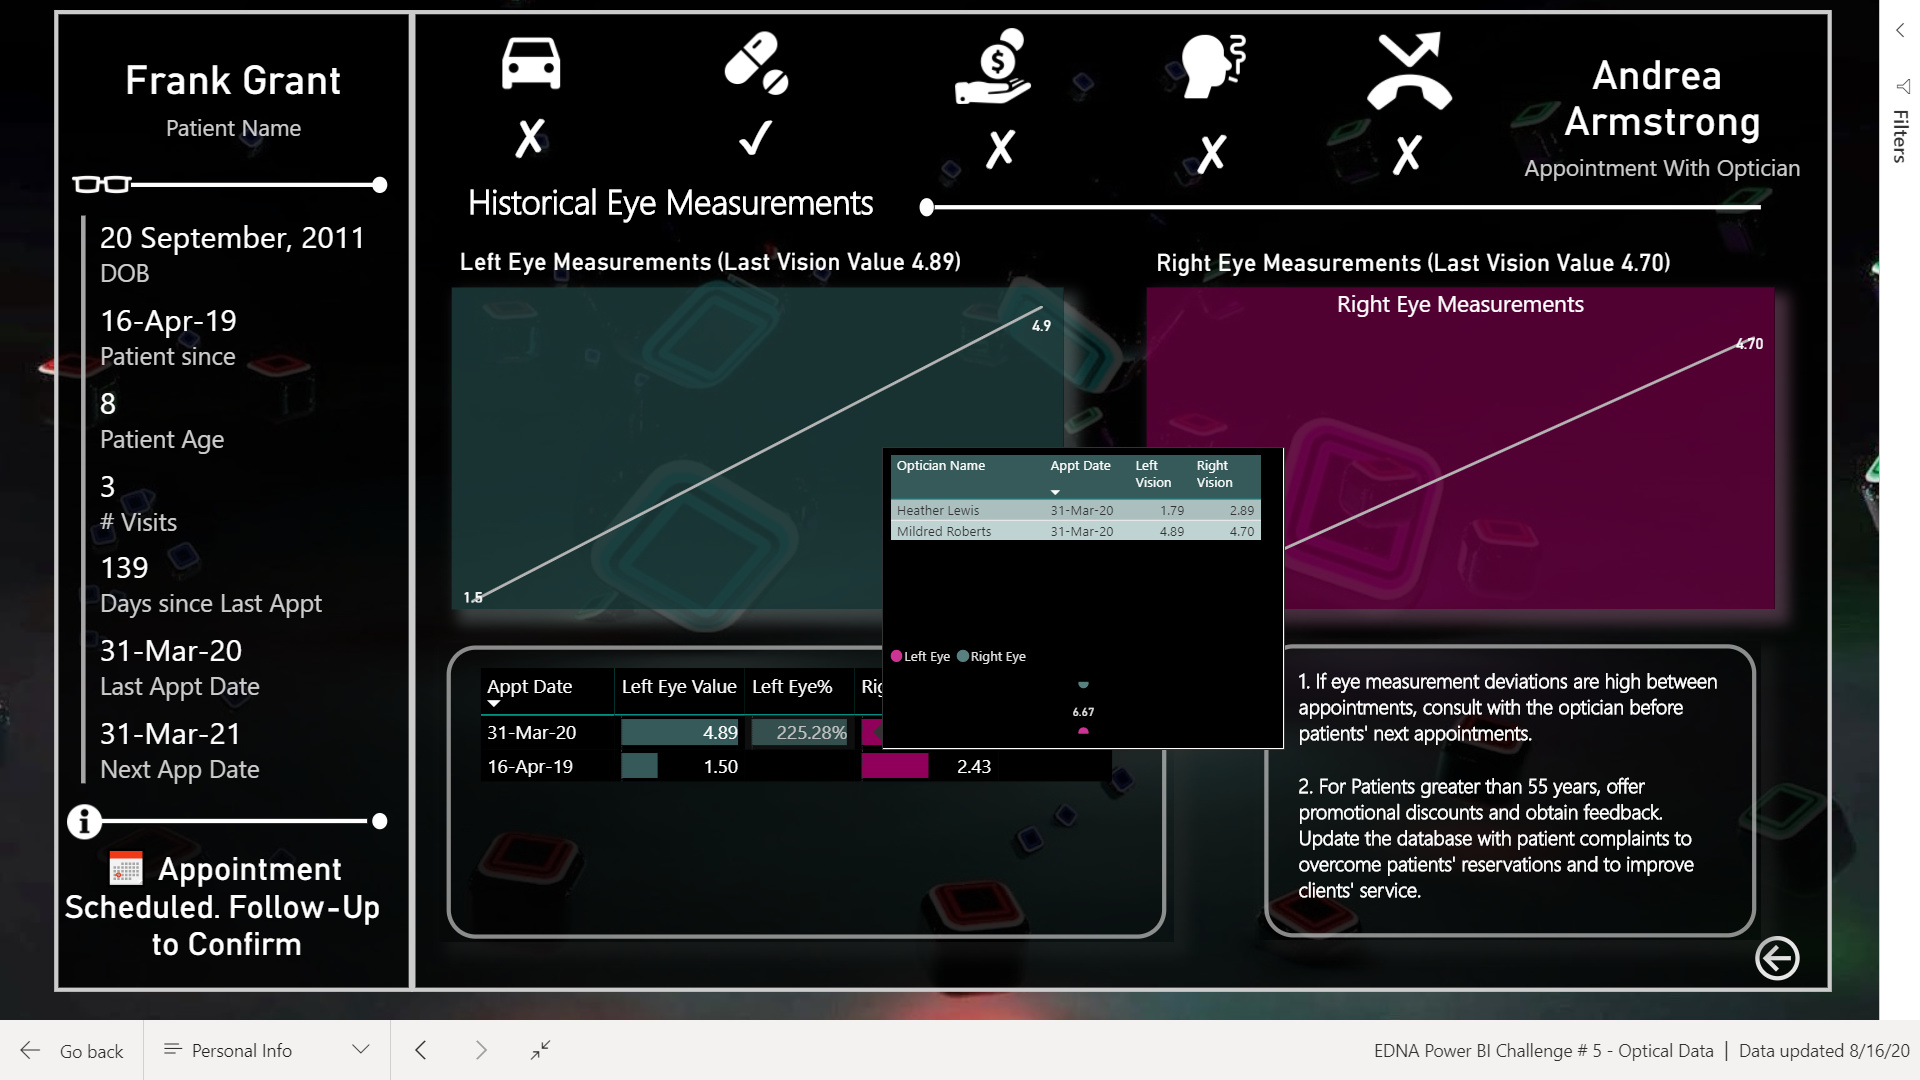
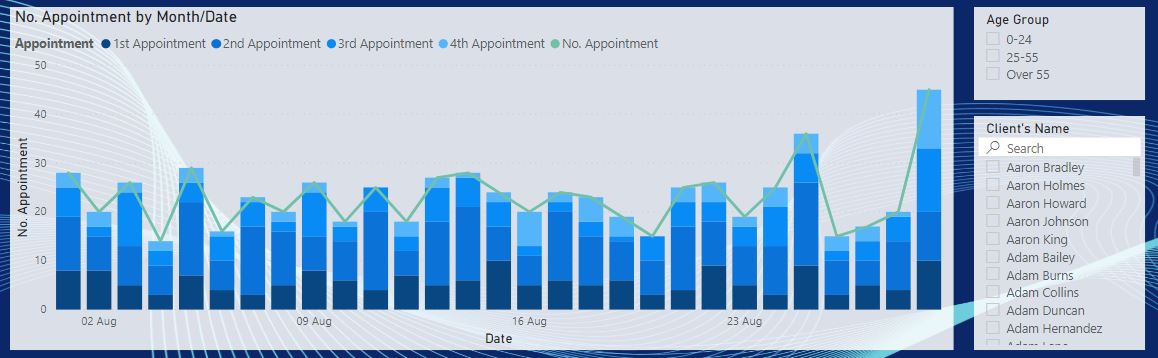
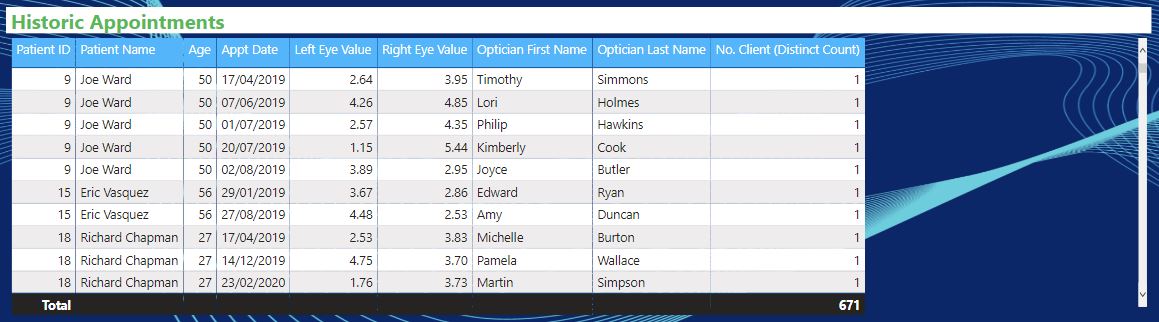
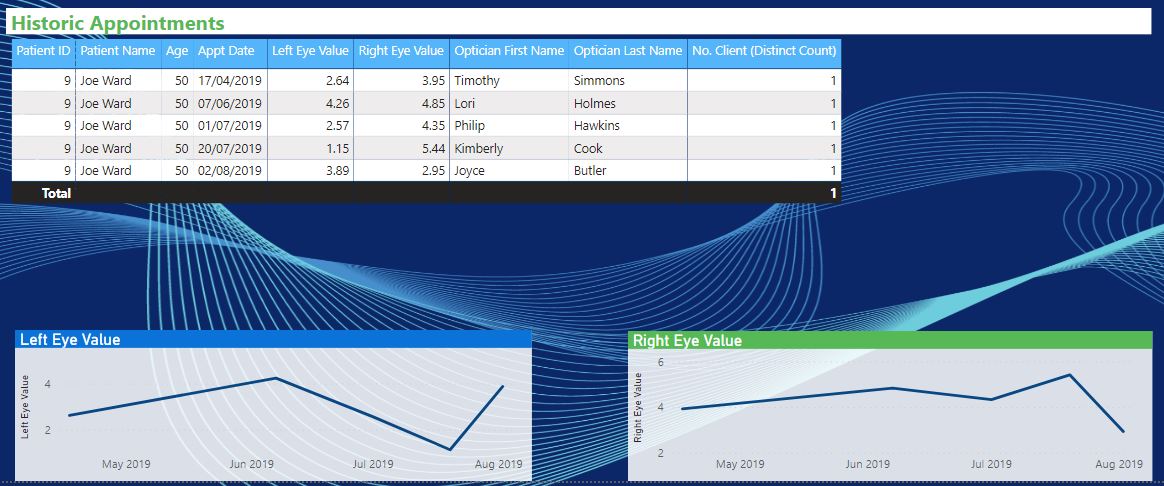
I have also used visual header tool tips to see vision details along with other appointment details.
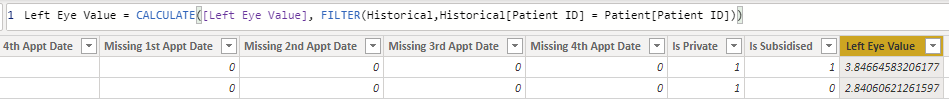
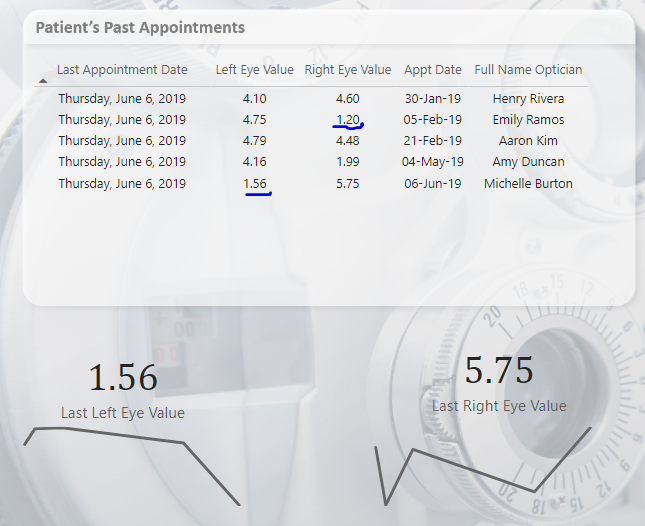
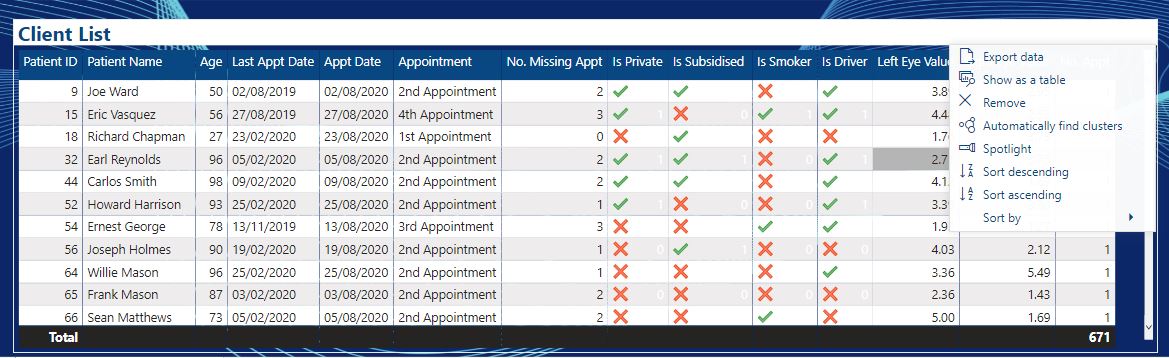
On the drill-through page, I have randomly selected the next optician. When you hover over the vision details, it will show who was the optician on a particular appointment date therefore, monitoring eye measurement deviations with optician names will provide Penny to take necessary steps/actions. For e.g. in case of Fran Grant, it is shown that on the same day, he was examined by two different opticians with two significantly different results.
In the end , go to menu page, click Log off and it will show the welcome screen. Yes, the name of the company is OPTICANS not OPTICIANS.
Analysis which I couldn’t do because of busy schedule:
- Creating detailed analysis from opticians point of view highlighting deviation measurements similar to what @Melissa did.
I wanted my report to be very simple and easy to navigate and hope that I managed to do so.
My DAX measures in the report are all over the place for now. I will arrange them afterwards and will also do the analysis from Optician’s point of view for my learning.
Following is the link to report:
Also attaching the PBIX file.
EDNA Power BI Challenge # 5 - Optical Data.pbix (3.5 MB)
Looking for feedback and suggestions to improve.
Thanks!


 .
.