Power BI Builds 4 - Delivery App Review

Hi @DianaB,
I am working with bookmarks today and have created a new ‘workflow’. I number my bookmarks in groups on a page. So on specific page, not matter what the page name, all bookmarks on that page start with the same number (say 01, or 02, 03 etc). I find this helps order them, find them and manage them. I hope this approach assists. See below for an example.

tip

1 Like

Thanks @jgriffit, I will try it in my next report. :slightly_smiling_face:

I got some inspiration for a report so here is my catch up number 4!

Check it out here!

6 Likes

@Melissa this looks really good. Is it ok if you can share the pbix file with me?

Thanks

Patrick

Hi @ambepat,

You can find all the entries to the challenges in the portal

Use the link on top to navigate to the files section where you can download the PBIX from anyone who participated in that specific challenge.

All the best.

1 Like

Hi everyone, @sam.mckay @haroonali1000 @BrianJ. I am a newbie with regards to Power BI. So I decided to take the Power BI Challenges from the scratch starting from Challenge 1. I am currently in Challenge 4, and I need help with adding a column that shows the minute difference between two time columns (Arrival and Departure time).
How can I do this in Power Query?

1 Like

@sibigbami01 Refer to this:

Date Time Difference - Query Editor - Enterprise DNA Forum

Kudos to you - that’s an awesome way to learn Power BI. I think what you’ll find is that as you advance through the Challenges, the participant writeups get better and better as we all got used to their addition to the Challenges. Combine those with reading @sam.mckay’s detailed critiques of each submission and it’s a really unique but extremely effective way to learn Power BI IMO.

Toward that end, in 2021 we will be developing some even more detailed expert walkthroughs of Challenge entries to help guide folks further in using these as a learning/training tool.

Also know that it’s totally cool to post your entries publicly in the Challenge thread even long after the Challenge has closed (eDNA Expert @datazoe did this recently for the Challenges she missed), and @sam.mckay will still review your submissions.

Keep up the great work, and give a shout if you have any other questions!

  • Brian

@sibigbami01

It’s a great way to learn and you will find yourself creating great reports in just after 2 to 3 challenges.
I would advise you to start with the current challenge (Challenge#10) to experience the collaboration while creating the report.

Best of luck on your reports!!

1 Like

Hi @haroonali1000, @sam.mckay, @BrianJ. Hi everyone.
I am a newbie in the Data Analytics space, and I decided to jump into the Challenges including the previous ones.
This is my attempt at Challenge 4, and I look forward to your feedback and learning ways in which I could be better.Delivery App Performance.pdf (712.2 KB)

2 Likes

2 Likes

@sibigbami01 I did mine in transform data by adding a column there:

Duration.Minutes(Duration.From([Store DateTime Exit]-[Store DateTime Arrival]))

I had renamed “DateTime arrived at store” to “Store DateTime Arrival” and “DateTime Left store” to “Store DateTime Exit”.

@sibigbami01,

Per your request, I wanted to provide some detailed feedback on your Challenge #4 Entry (and again, I absolutely love that you’re going back through the past challenges as a way of learning and improving your skills).

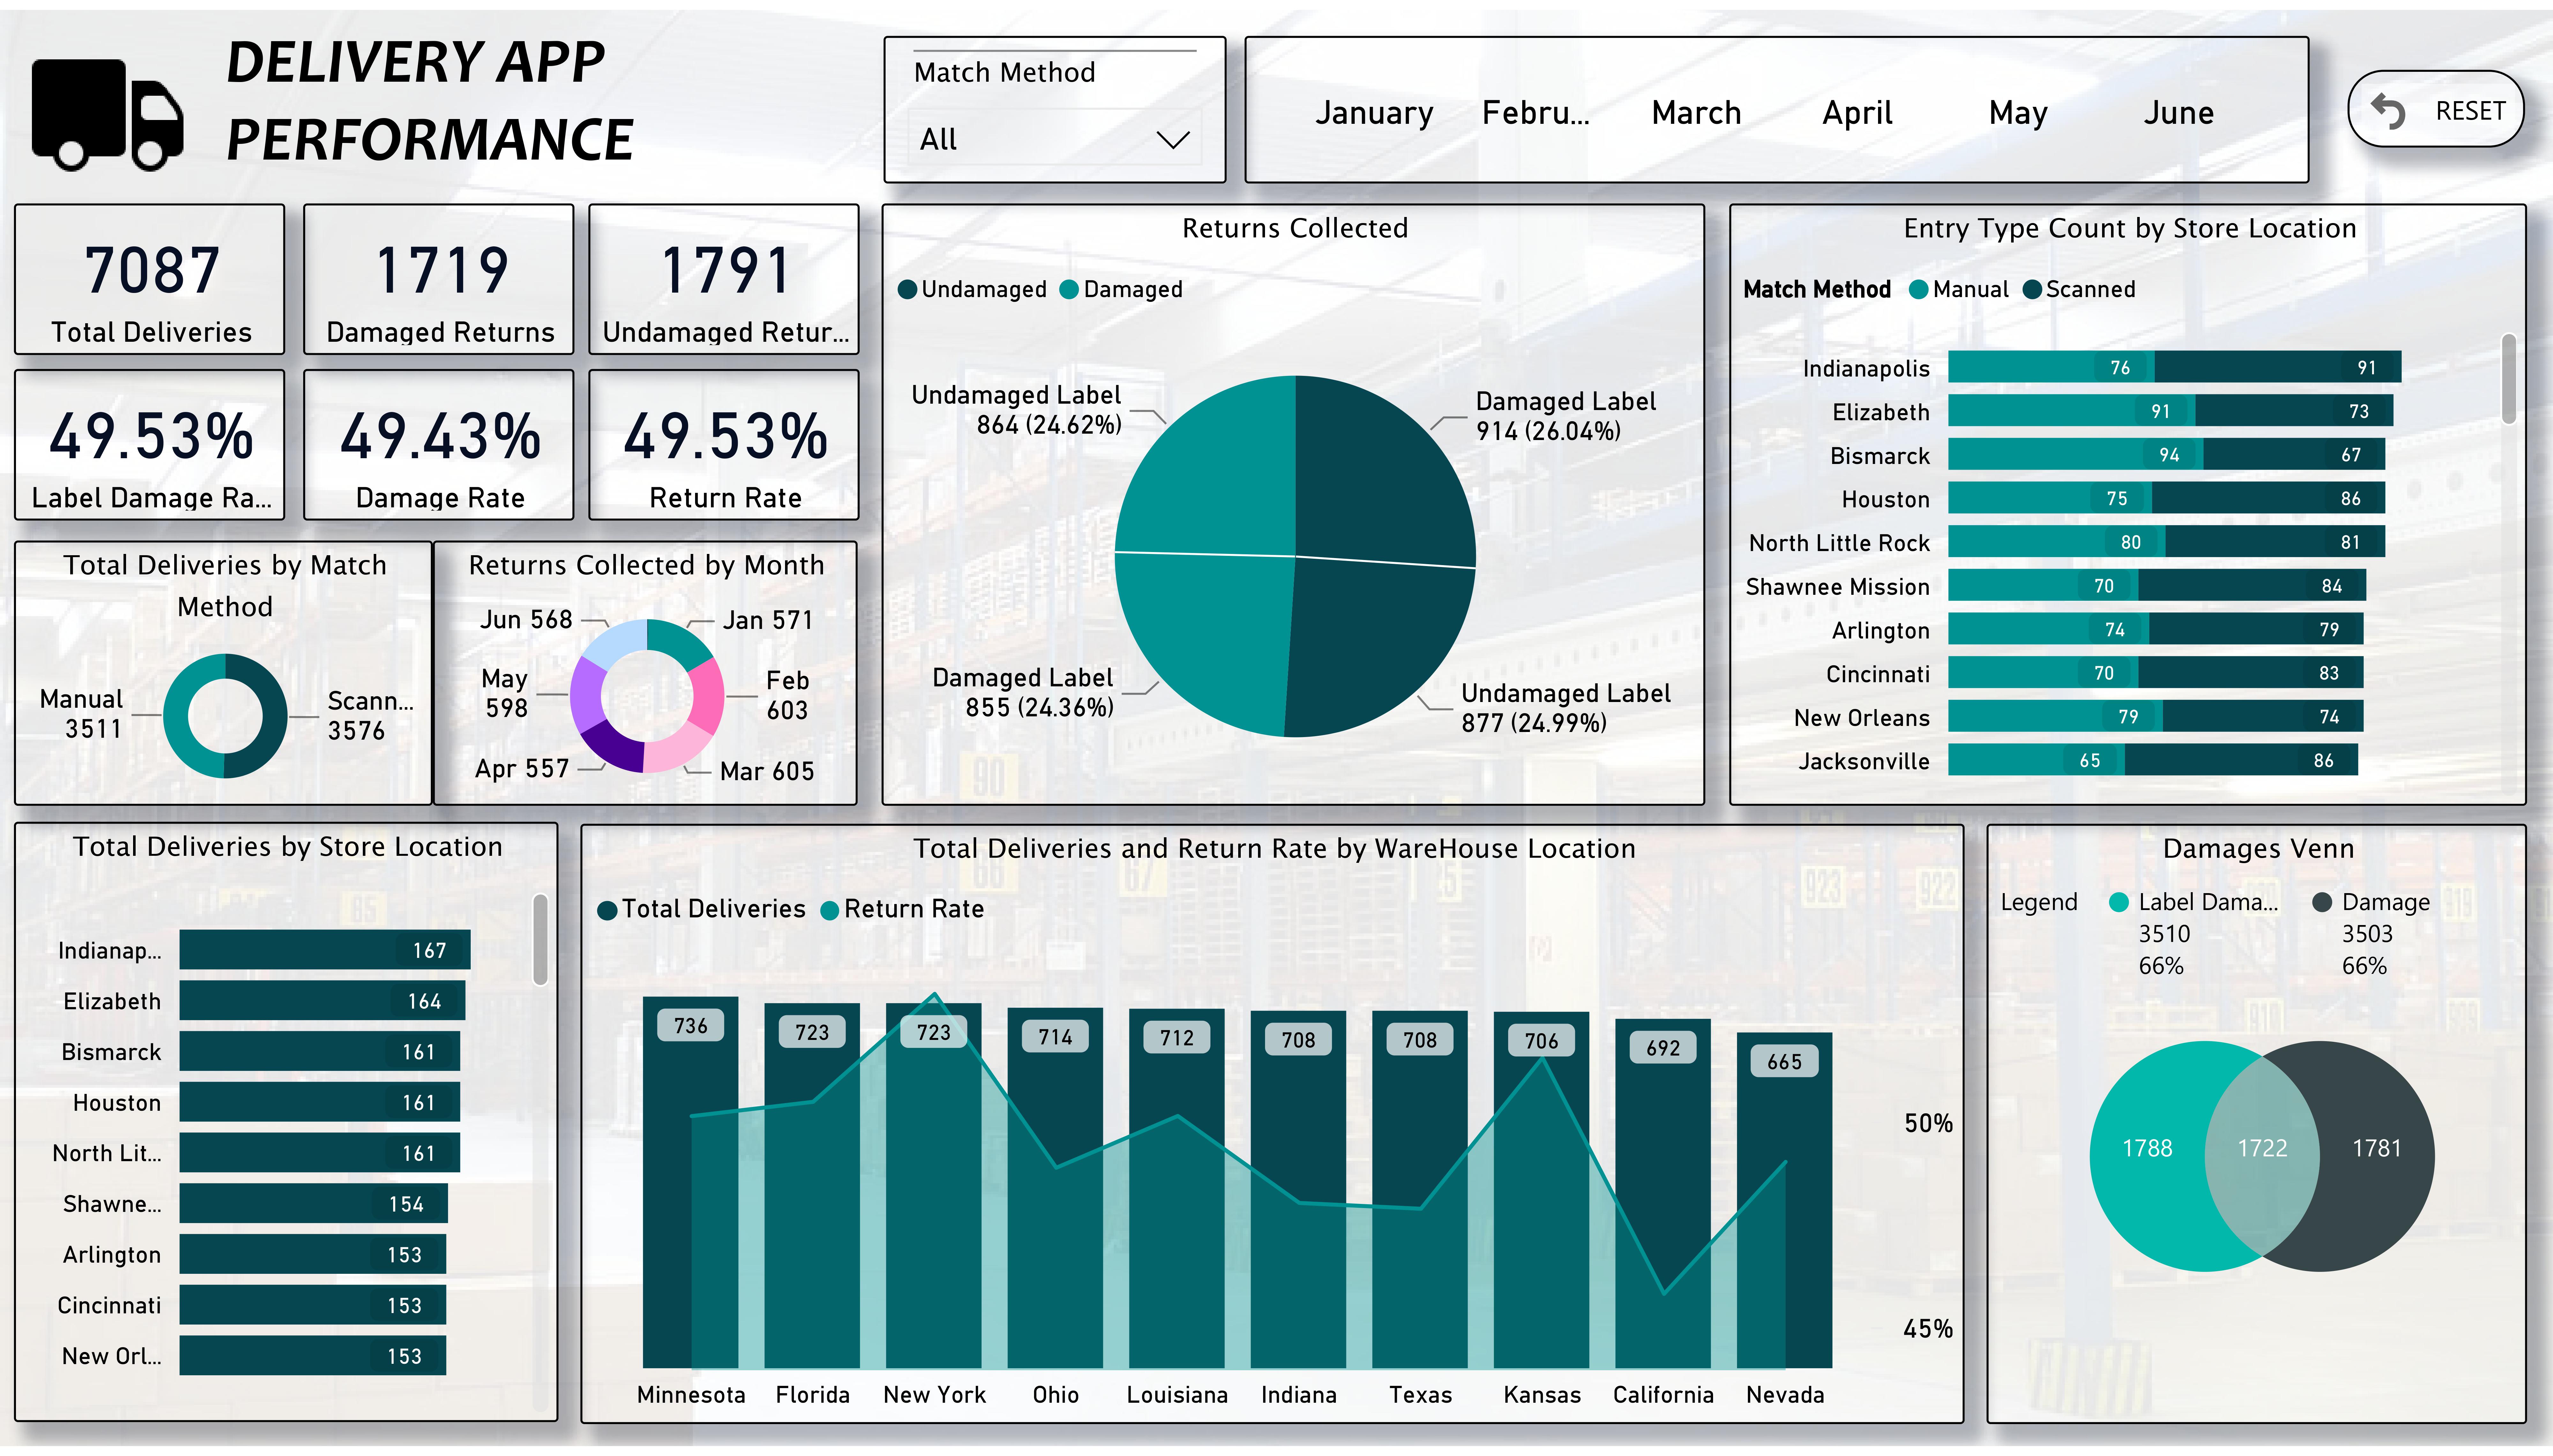
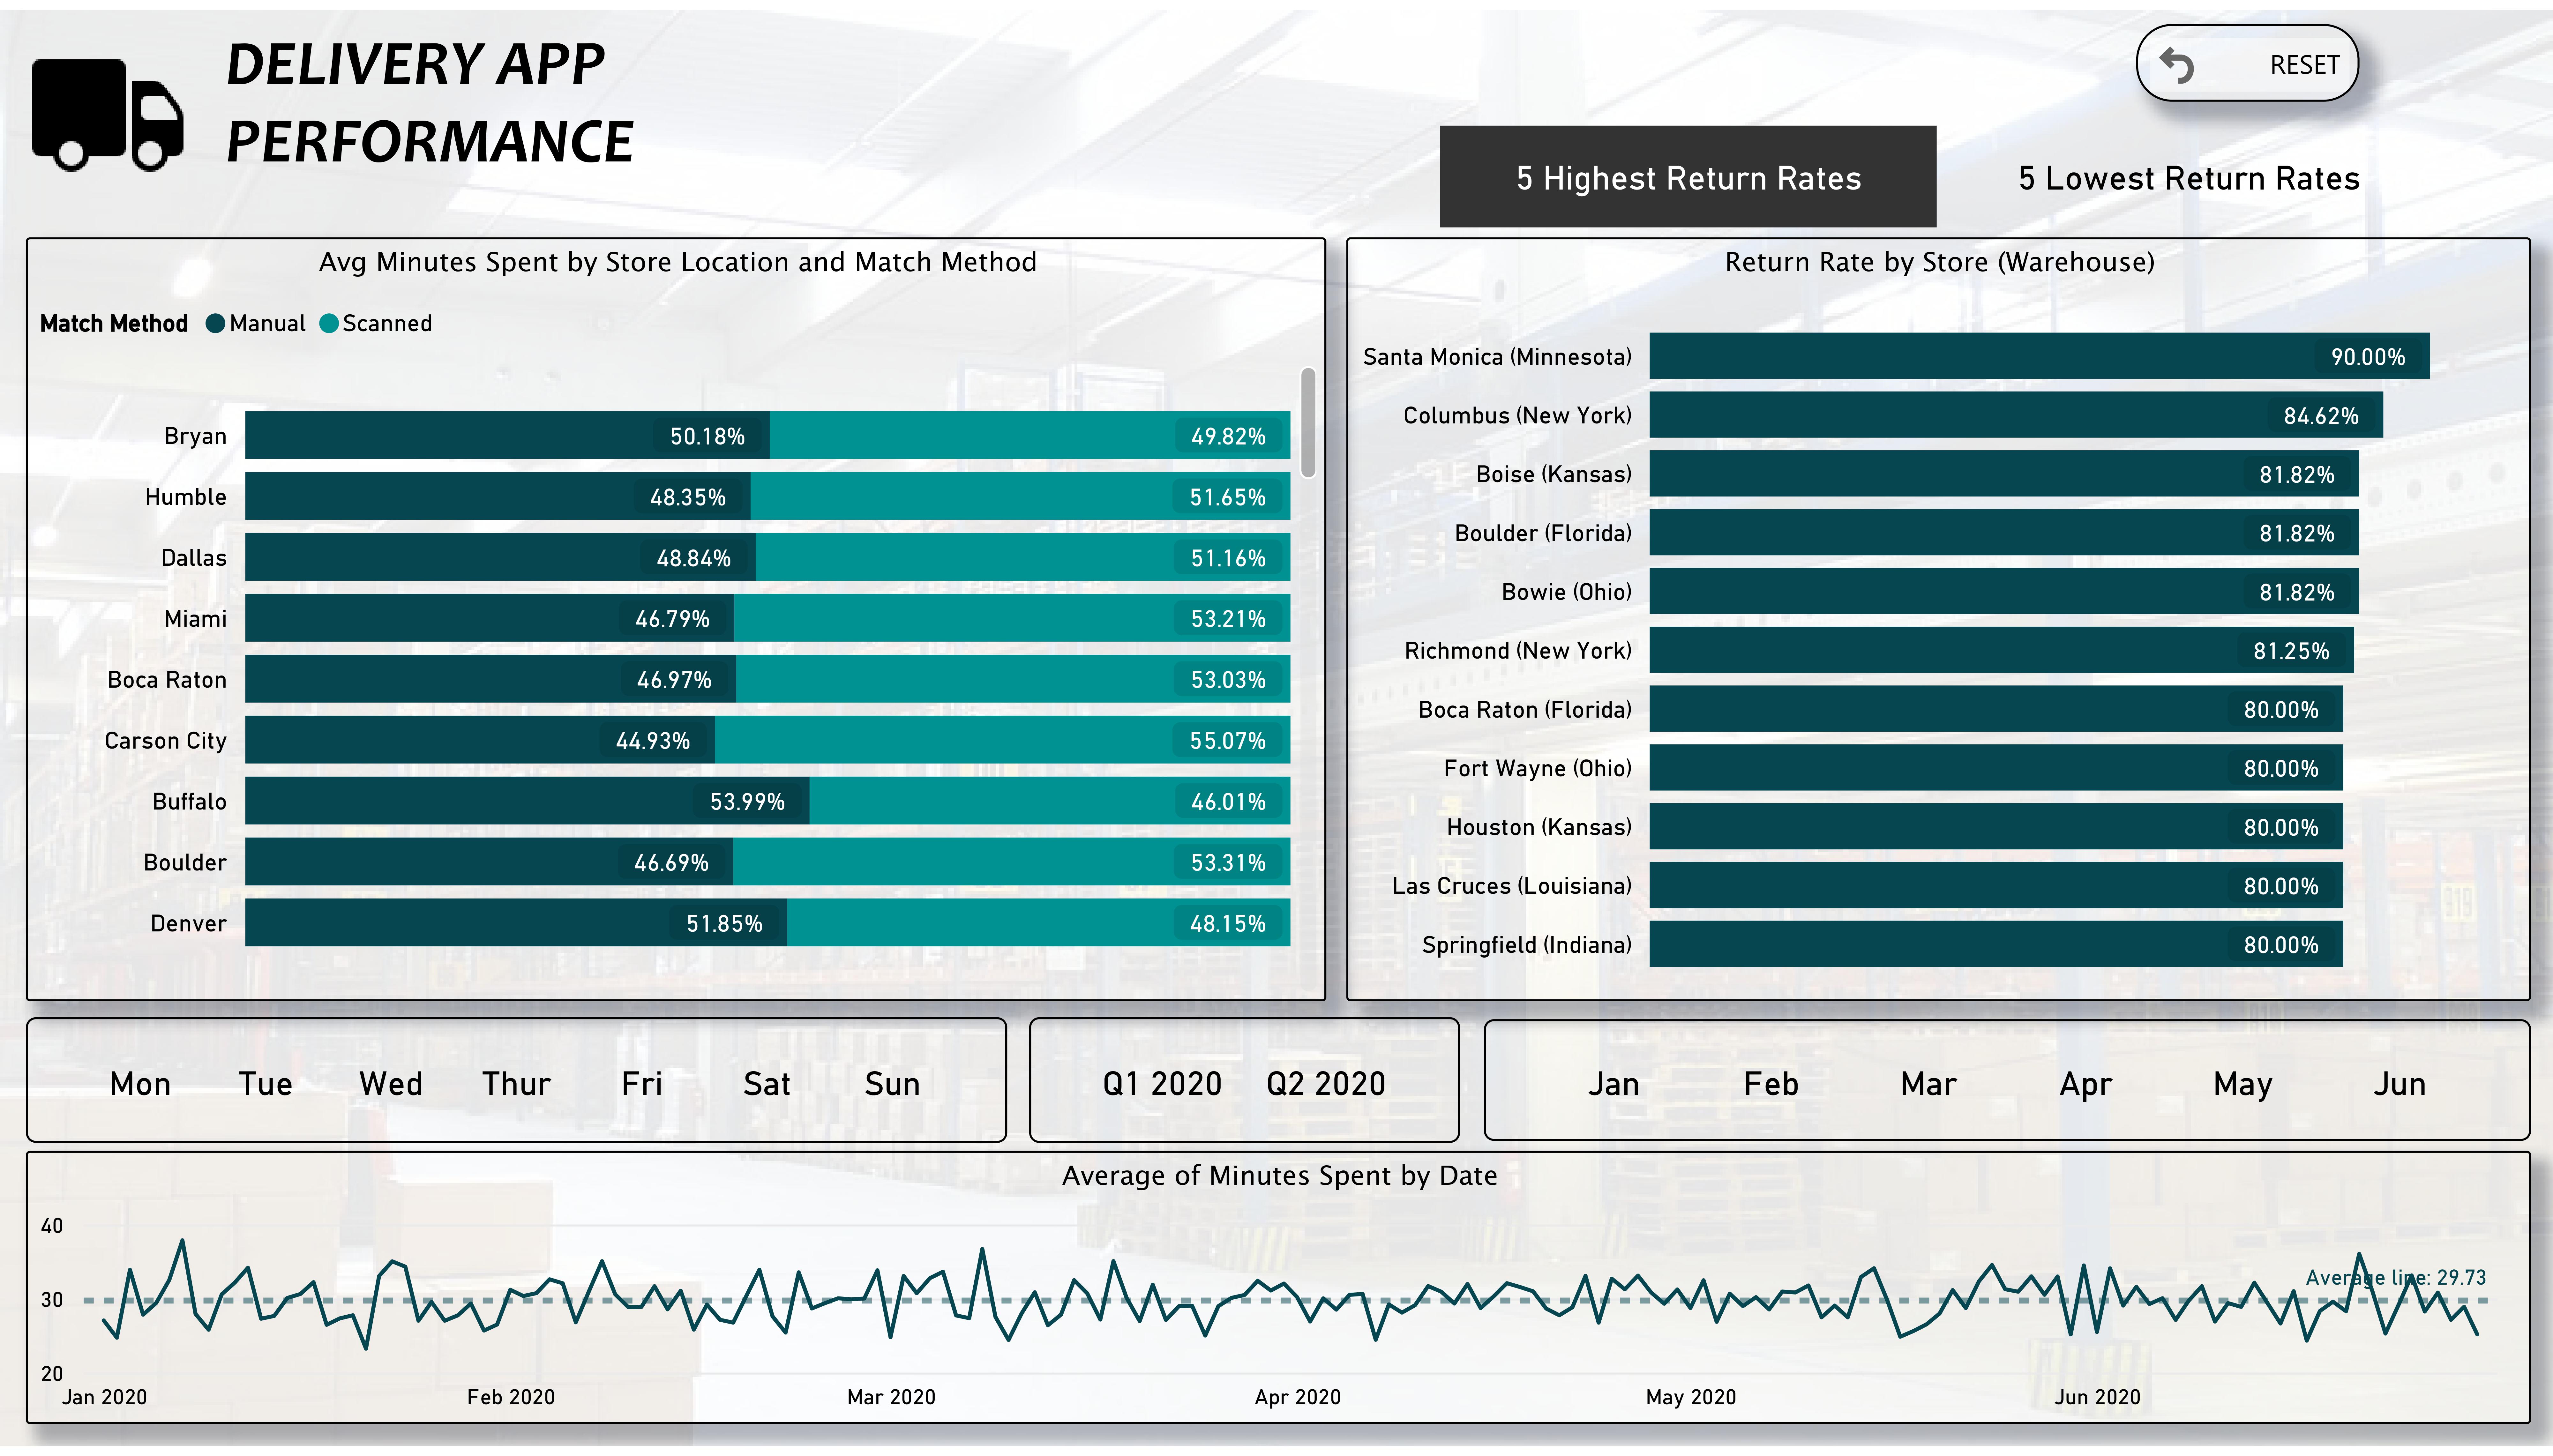
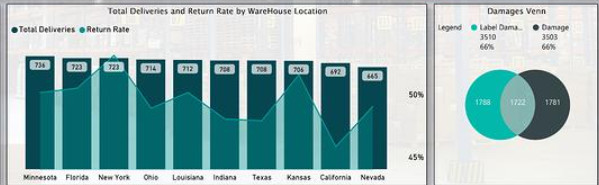
There’s a whole lot I really like about this report: you’ve done a wide range of analyses that are highly relevant to the questions around which the brief is focused, your design and color scheme is relatively simple but attractive, it’s built on a nicely gridded structure per @sam.mckay’s ecommendations, slicers are efficiently organized as not to take up too much space, and I particularly like your choice of visualizations in a number of instances, particularly these two (I don’t see Venn diagrams used frequently, but think they are very effective in conveying certain types of information):

image

I also think the addition of the reset button is an excellent feature, and include it on almost all of my reports.

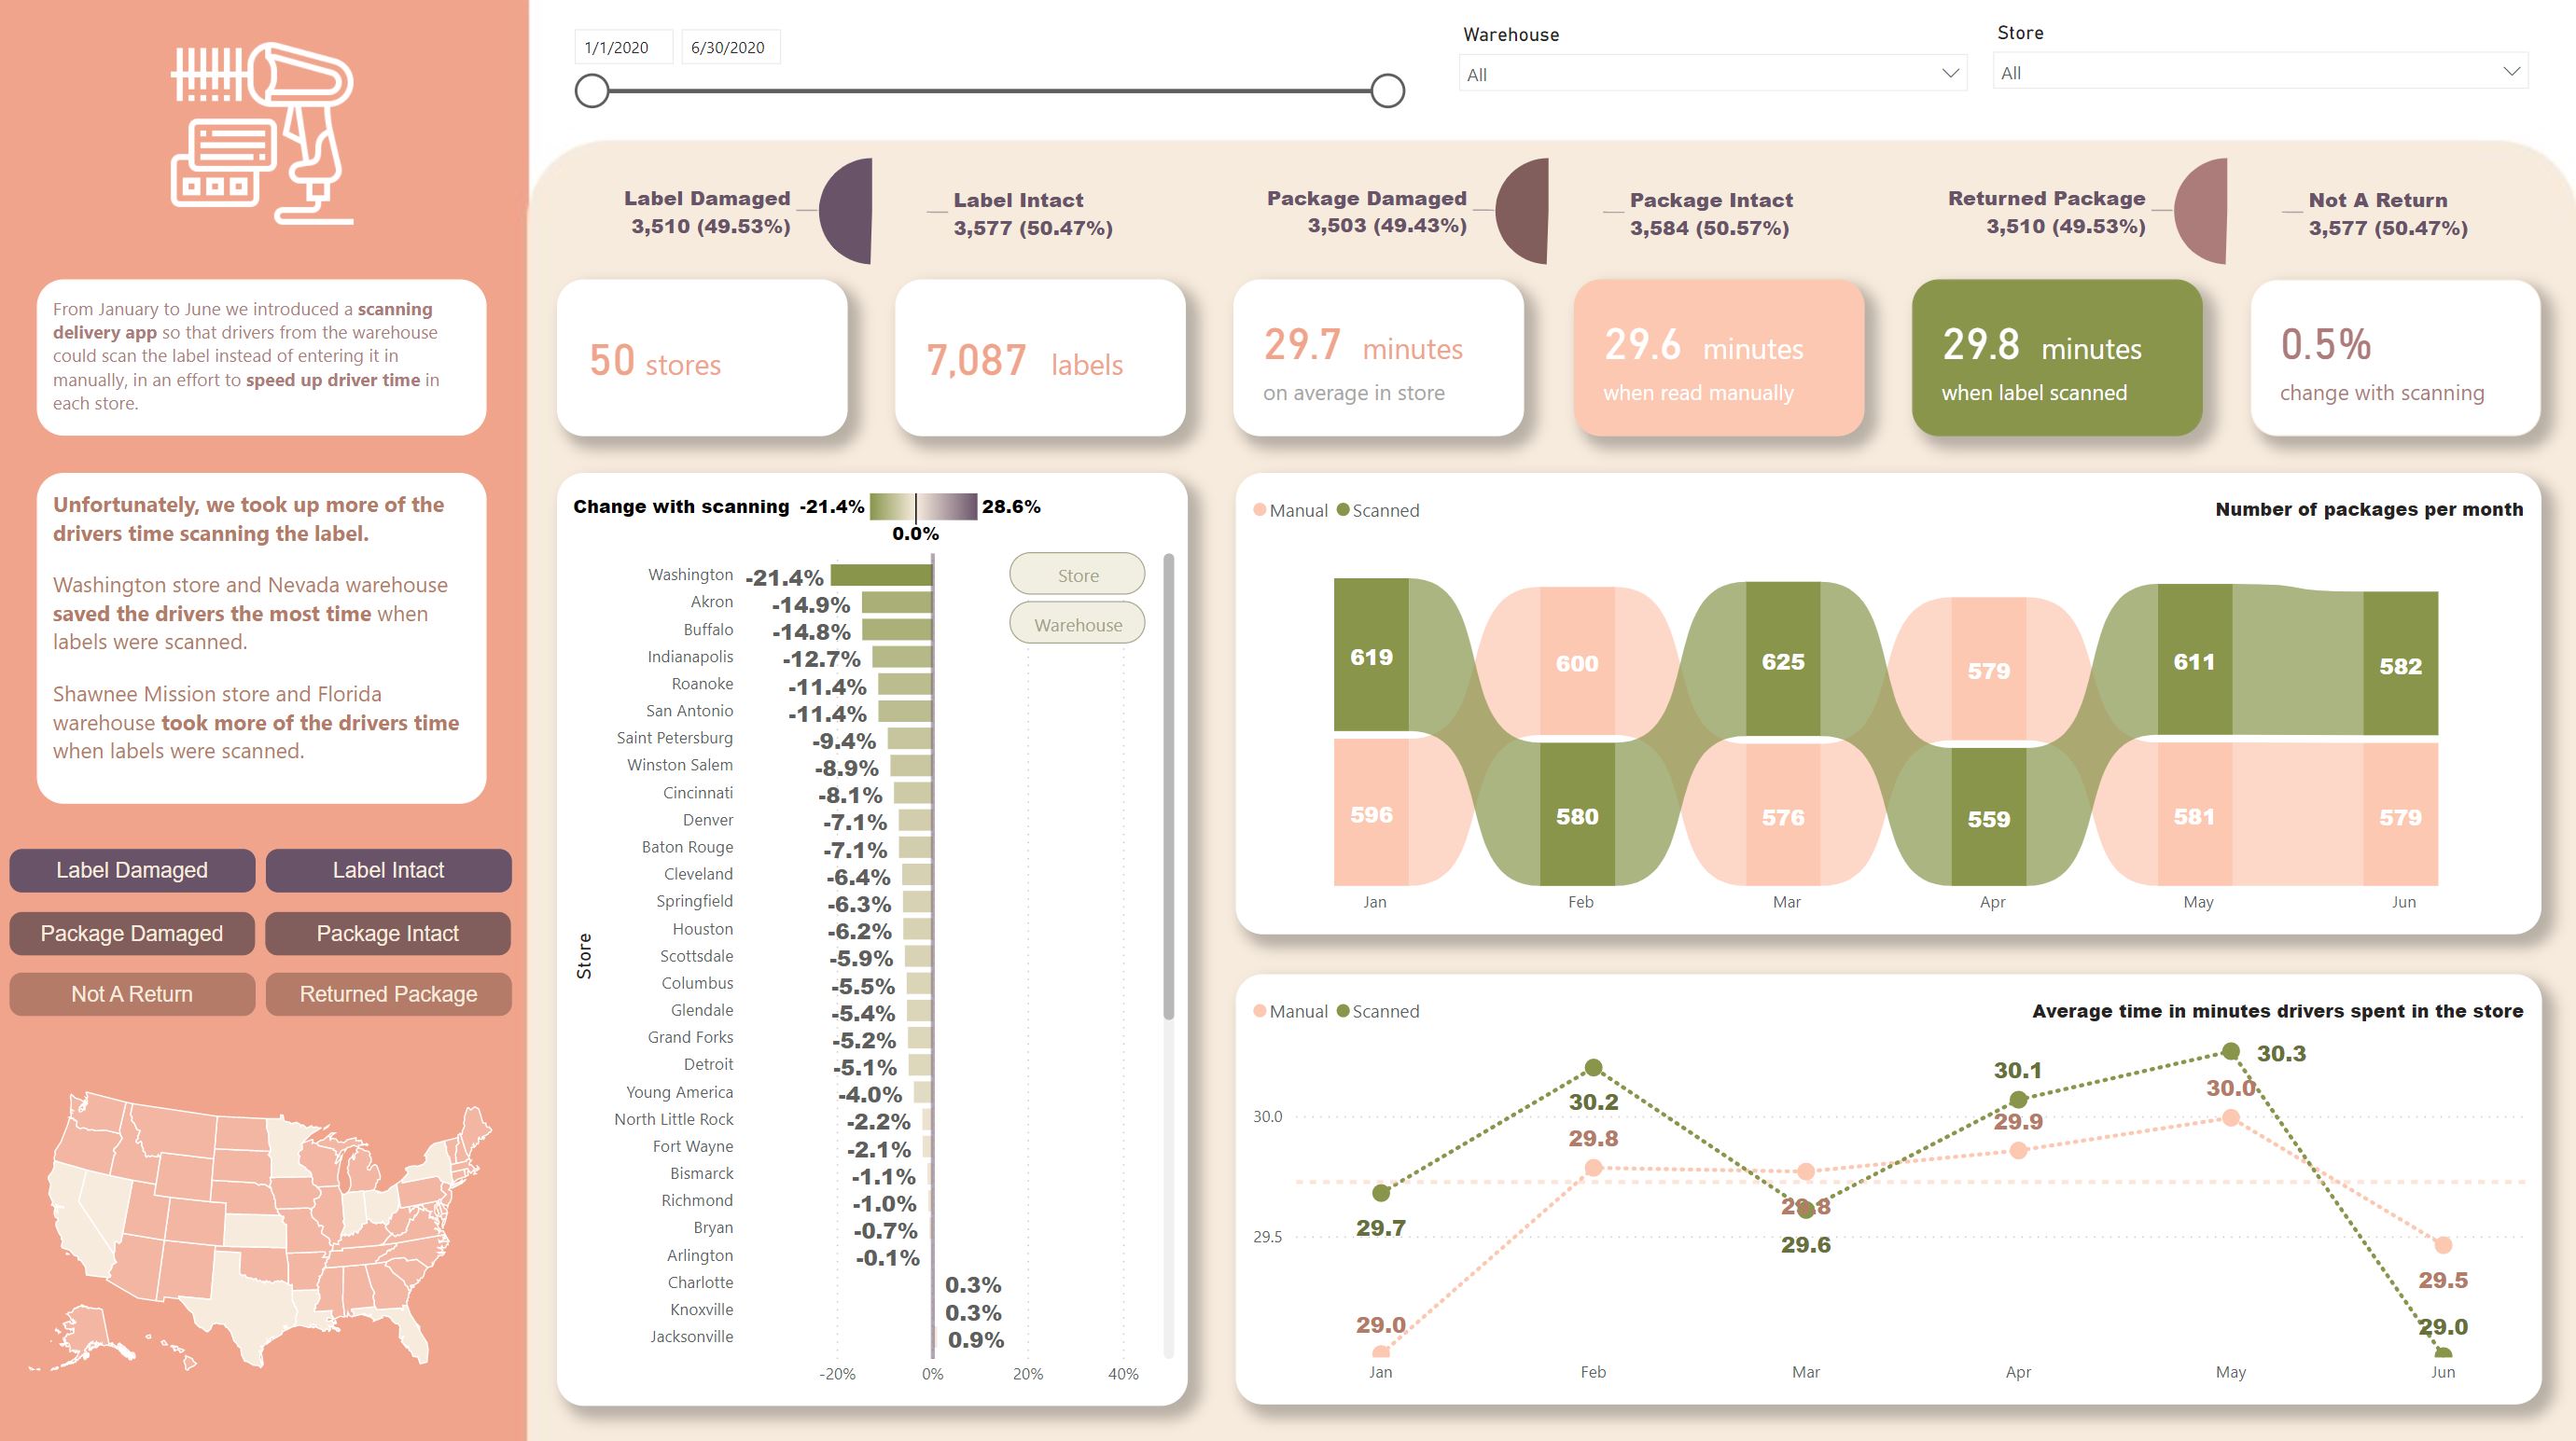
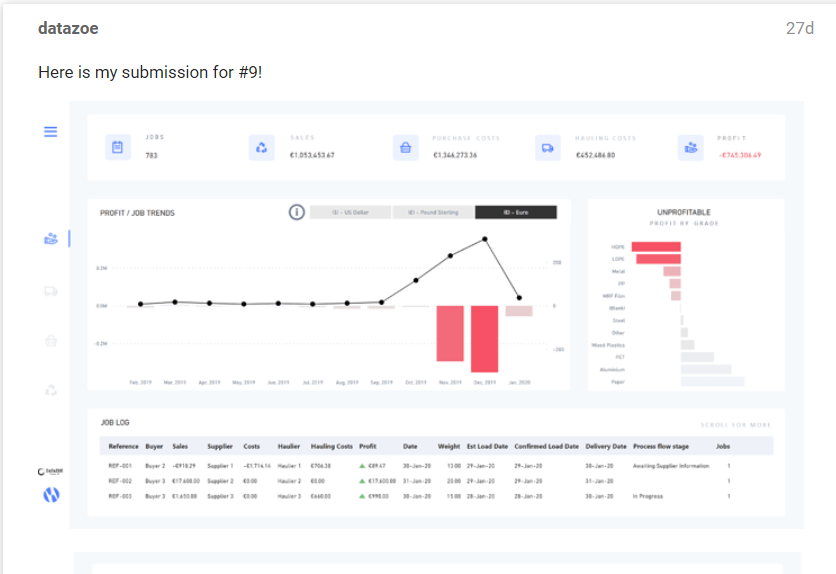
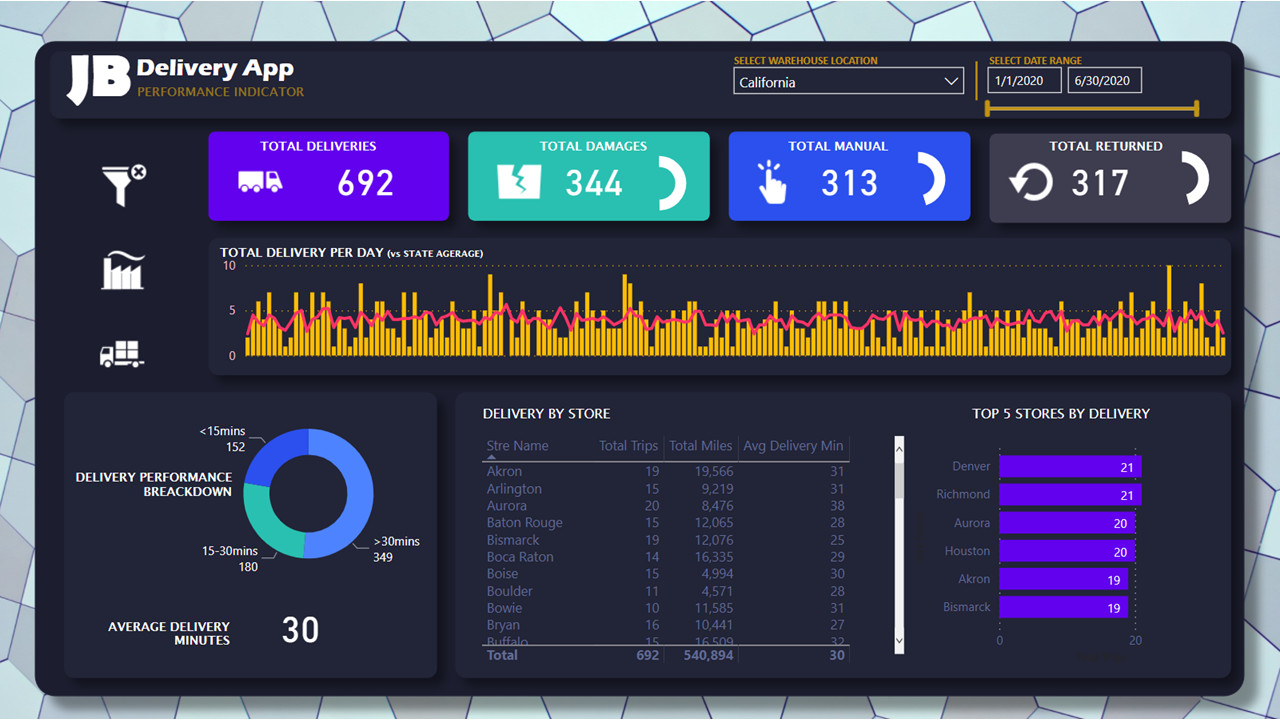
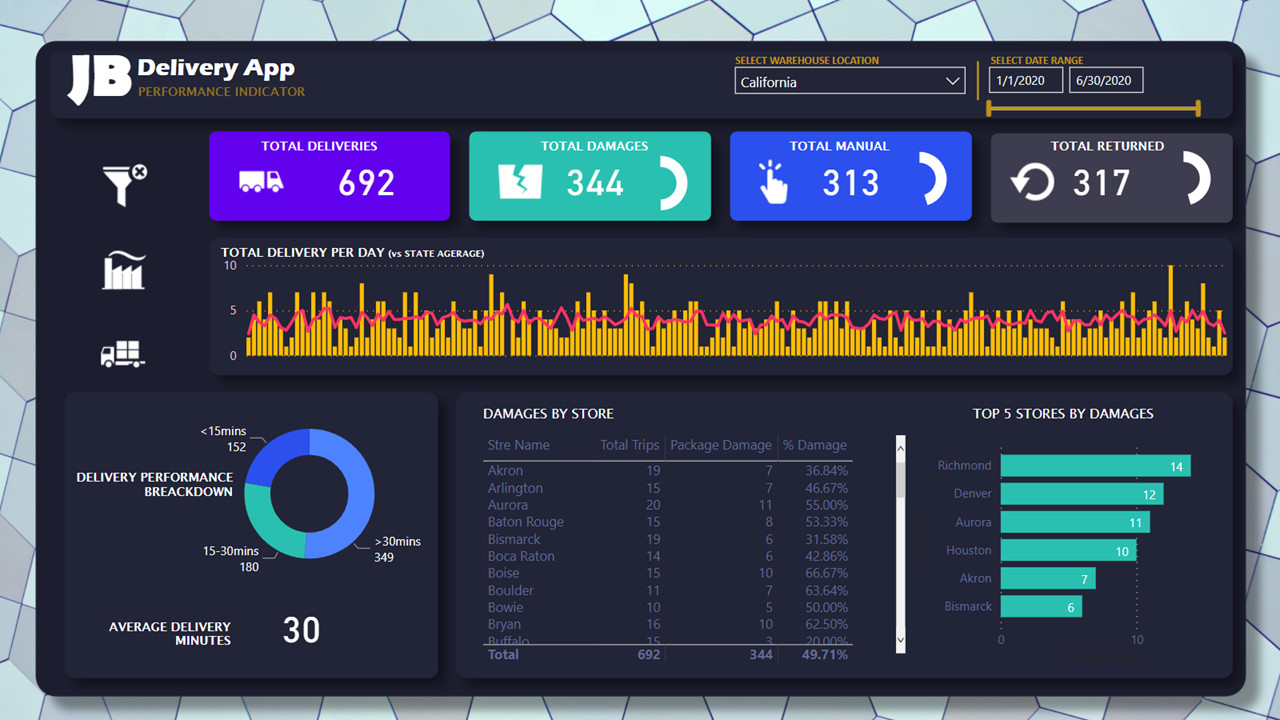
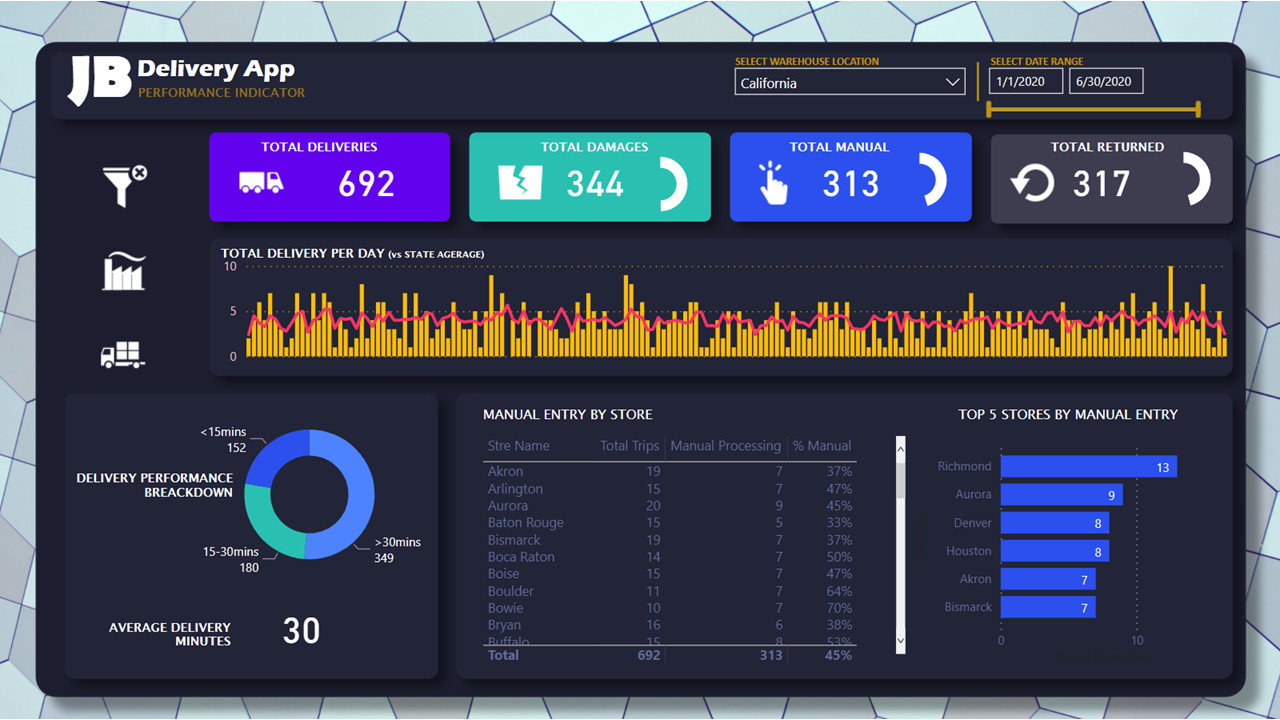
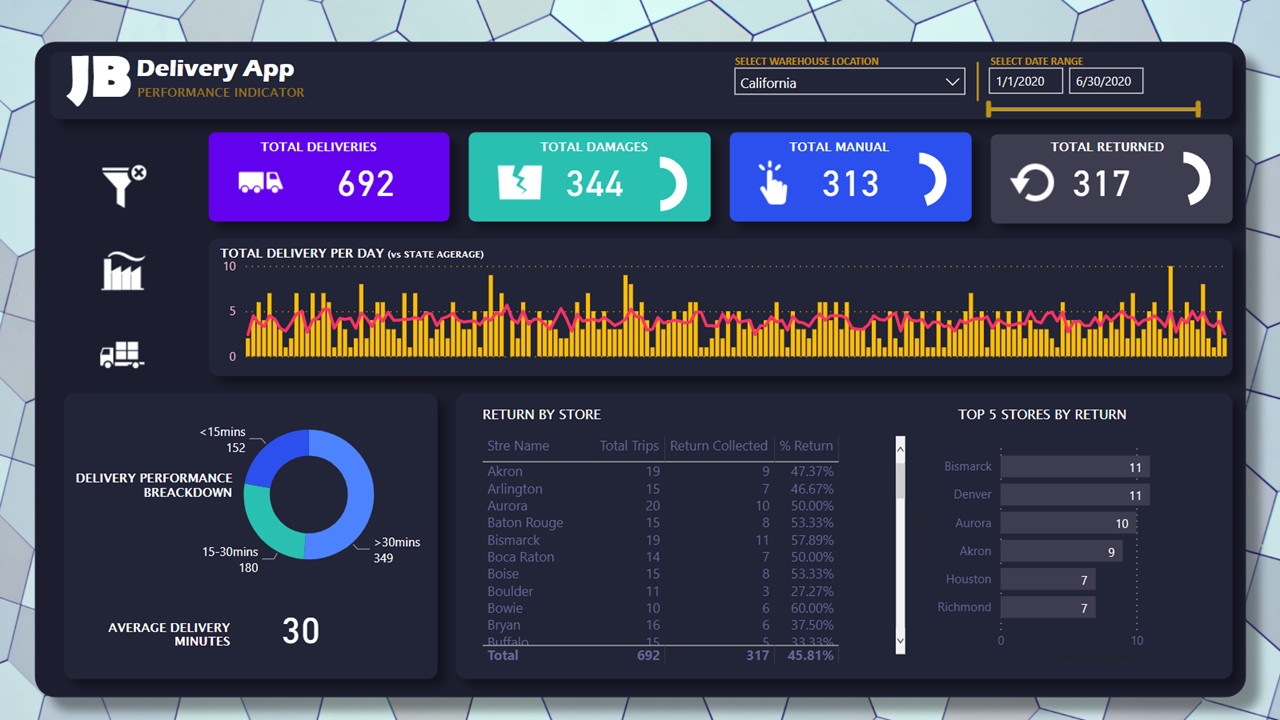
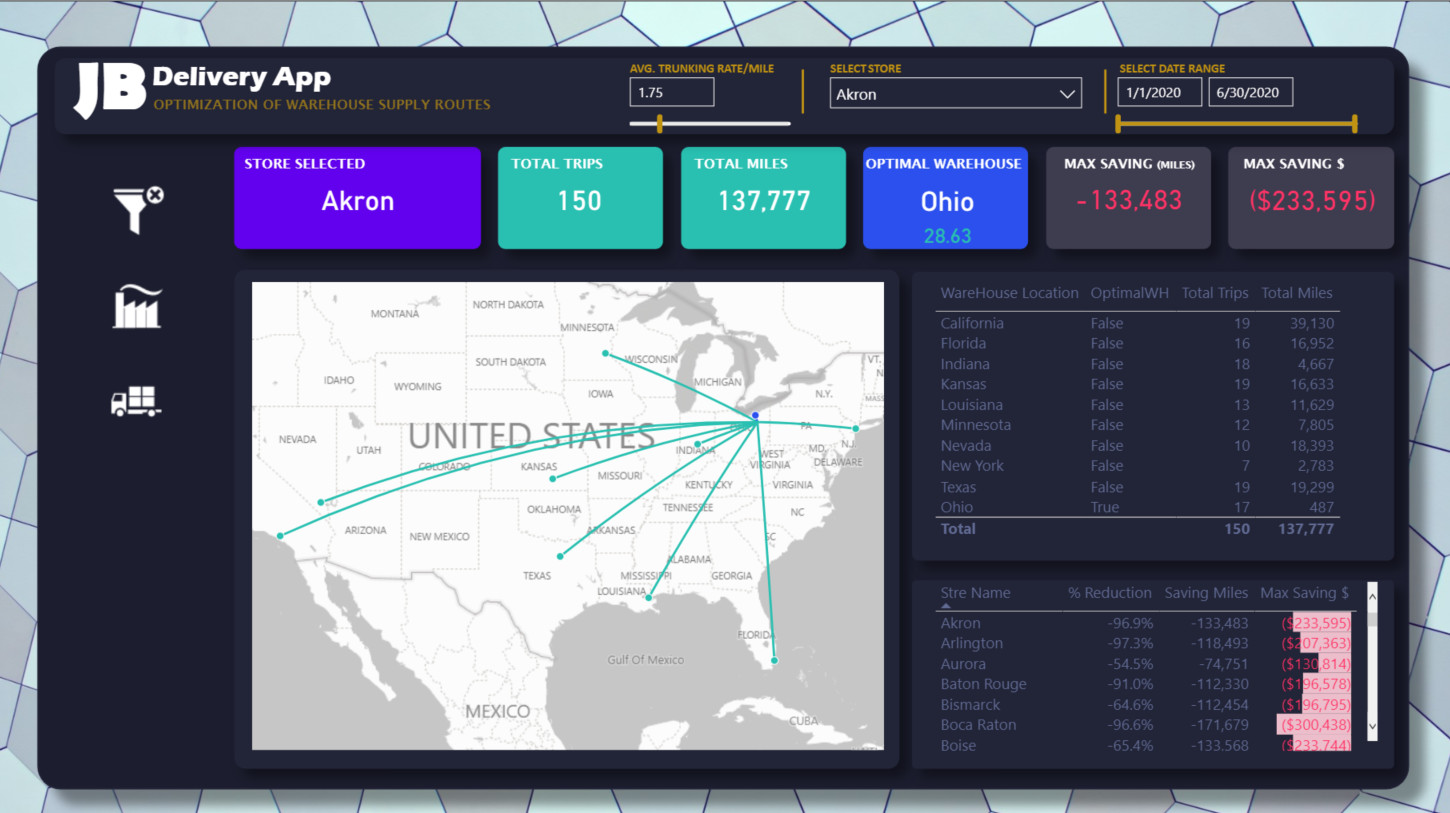
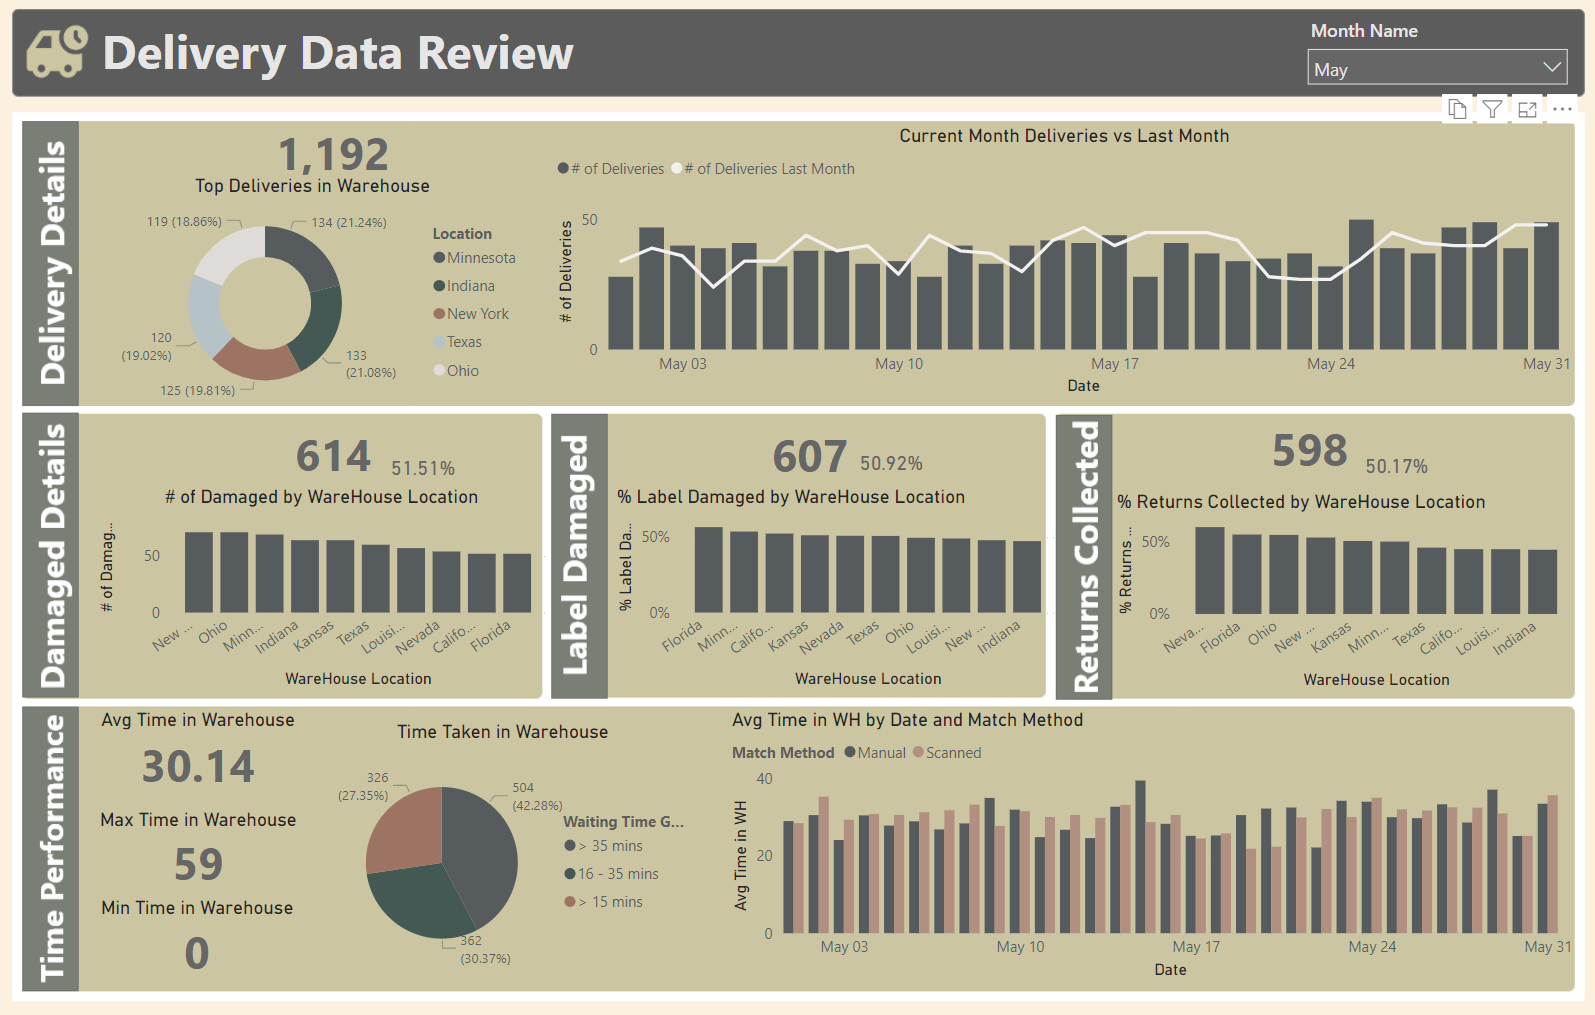
In terms of things that I think could be improved, the biggest area IMO is with regard to data storytelling. I think you should always ask yourself “what is the most important thing on this page, and will the answer to that question be obvious to the viewer”. Looking at the first page of your report, it has 13 separate analyses on it and I’m not clear as to what the most important one is. Based on size and positioning it would seem to be the “Returns Collected” visual, but I’m not sure that’s what you would’ve intended to takeaway to be. In addition, whenever you break with your color scheme, that is a flashing light to the viewer that “this is important and should be paid special attention to”, but again I’m not sure how that squares with your intent. Here’s an outstanding example from a report of eDNA Expert @datazoe that I absolutely love, and where the break from the spartan black-and-white color scheme was very intentional and extremely effective:

Based on size, position and dramatic break from color scheme, there is no ambiguity that the most important element in this report is profit.

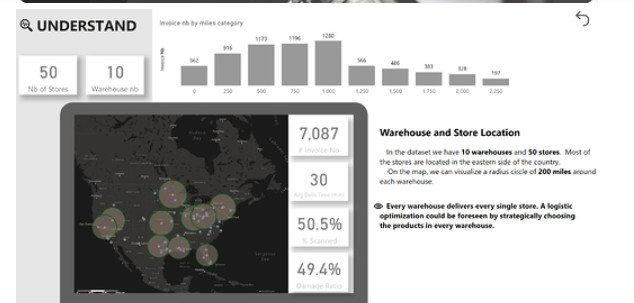
Expert @alexbadiu’s winning entry in Challenge #4 was an absolute masterwork of data storytelling, with his analyses divided up by the themes of understand, explore, and take action. Even though there is a lot of analysis on this page, it never appears crowded, the most important elements are framed by the creative laptop graphic, and the accompanying text provides additional guidance to the viewer.

image

These are challenging but vitally important concepts to incorporate to make your report as intuitive and useful to the viewer as possible. Going through the submission write ups will be a big help, and additionally in 2021 some of the best designers out there, including @alexbadiu, @Greg, @MudassirAli and @JarrettM, plus of course @sam.mckay will be creating new videos and member course modules focused on improving report design, visualization and data storytelling. In addition, we are going to be doing some interview-type content including one called Design Roundtable, where expert Power BI developers/designers discuss their philosophies and approaches to report design, so stay tuned…

One final point – and certainly not everyone will agree, but pie and donut charts always give me a bit of pause. I won’t say they have no place, but I would always question before using them whether a better visual is available. Here’s a great article about the problems inherent in those visuals.

I hope this feedback is helpful. For someone relatively new to Power BI, you are off to a terrific start, and I think with your study approach and openness to input, you will be creating absolutely knockout reports in short order.

  • Brian
1 Like

Thank you so much for this review @BrianJ. I really appreciate your help, and I will keep on striving to get better.
Honestly speaking, I couldn’t have asked for a better community of professionals.

1 Like

Thank you so much @datazoe

1 Like

Hi everyone, @sam.mckay @haroonali1000 @BrianJ. I decided to take the Power BI Challenges that I missed. I just finished Challenge 4. This is my first dark theme report.

I took some ideas from @sam.mckay and @BrianJ submissions and I want to share a M function for calculating distance between two geocoordinates.

Jose Bressan

Online Version

8 Likes

Awesome work @jbressan.

Love the fact your going through previous challenges and I hope you’re seeing the benefits in retaining and applying your knowledge.

oooh that function looks super handy!! Great work! Thanks for sharing.

Haroon

1 Like

@jbressan,

Echoing @haroonali1000’s comments, there’s literally nothing I see on the forum that makes me happier than someone going through past Challenges and/or Problems of the Week. That sort of disciplined, focus practice is the absolute fastest path to really high-level proficiency in Power BI. Keep up the great work - both your Challenge submissions and POTW solutions are excellent and continually advancing.

One question - are you an Analyst Hub user? If so, it would be great for you to post that M function to the AH Community section for others to easily grab into their code library and have at their fingertips to apply when needed. If not, I can post it there (with full attribution, of course).

Great stuff. :+1:

  • Brian
1 Like

I have basic access to Analyst Hub and Yes, you can post it. This community is for share our knowledge and learn together.

Hello Everyone,

Hope you are doing well!

Here is my submission on Delivery App Review. I would like to get feedback and suggestions on my work.

Thank you!

3 Likes