Here’s the entry from one of our non-member participants, AW.
2 Likes
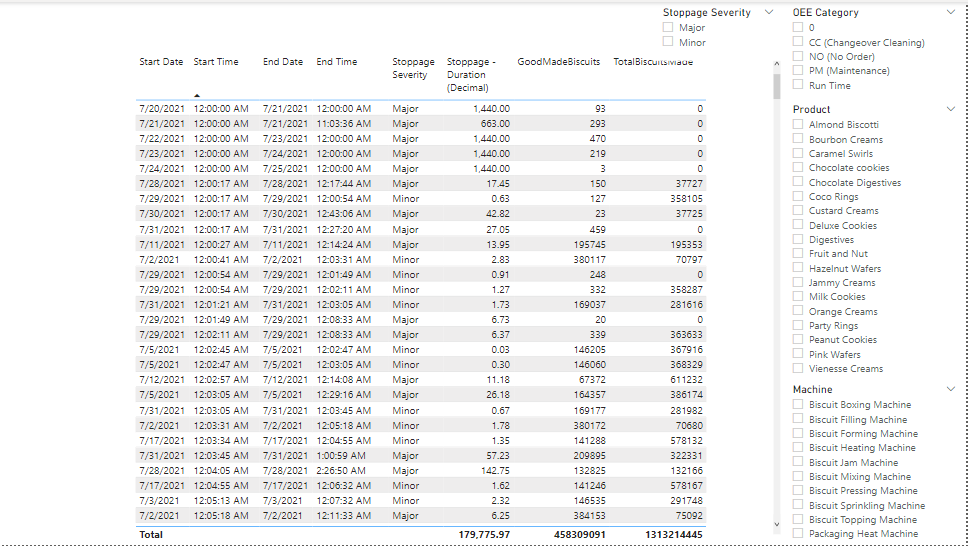
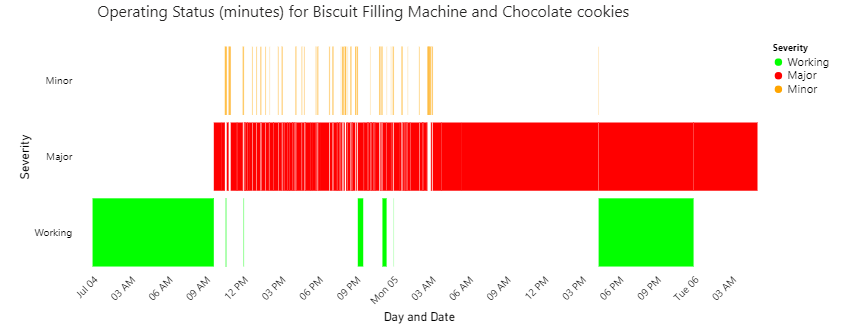
Started my journey learning a bit more about OEE. I wanted to create visual showing the runtime and status (working, major, minor) – something I did not find in the visual library. Also wanted to split multi-day outages to create separate rows for each day (production reports would probably drilldown to shift.) Some problems include overlapping outages and start/end datetime in minutes but durations in seconds. (Will be interested to learn from other participants how they addressed these issues.) The snippet below from the Add Good tab of the pbix shows this.
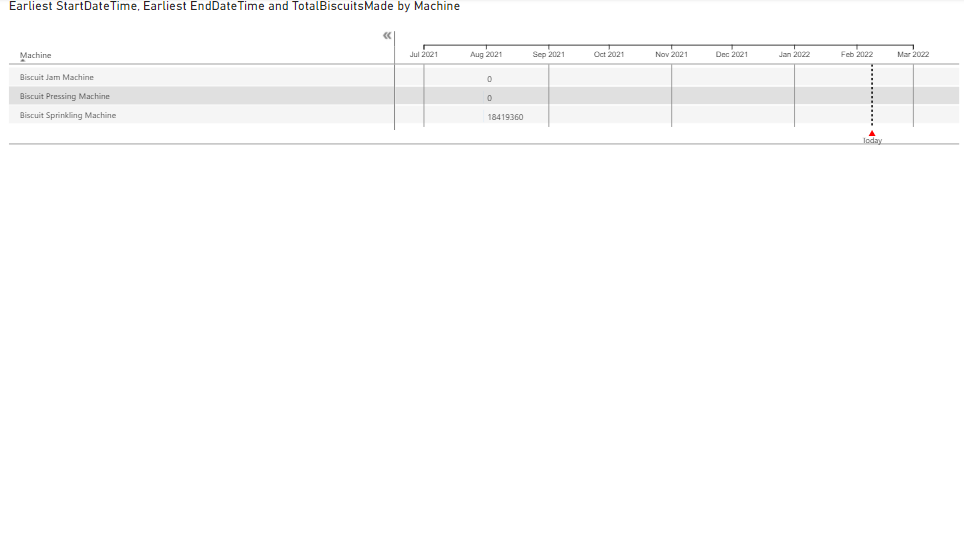
After a bit of wandering around the power query landscape looking for signposts left by Melissa and BrianJ I was able to create the visual shown on the Initial tab from the Fact query.
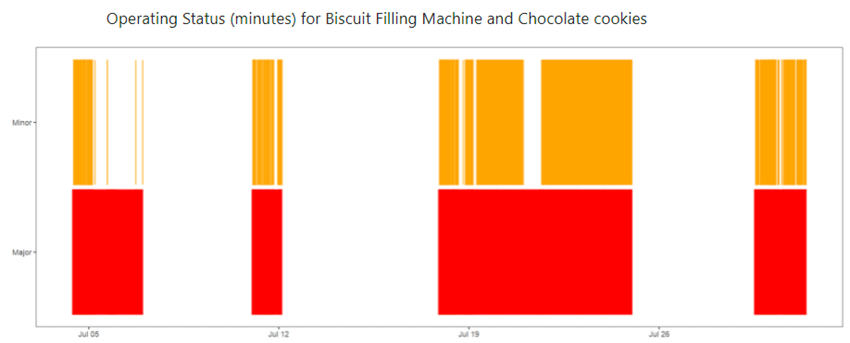
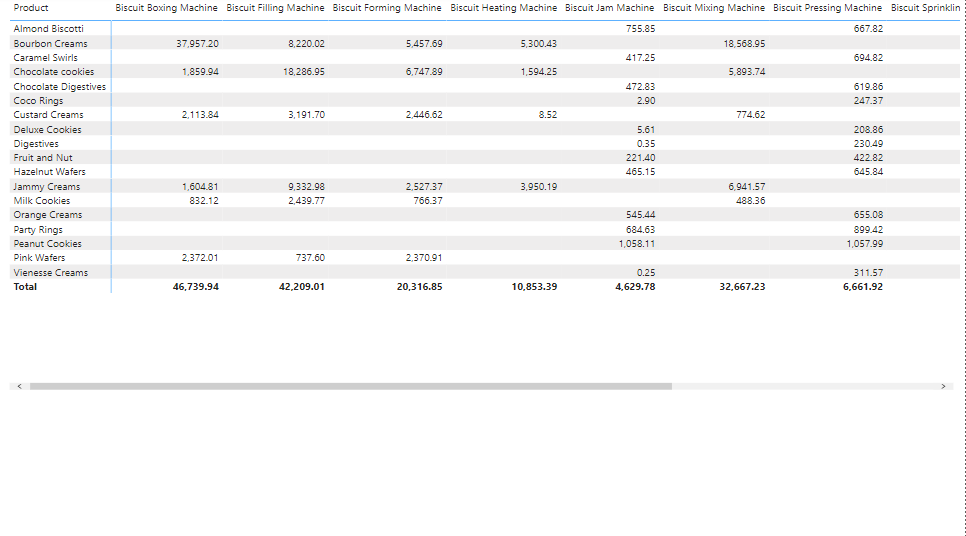
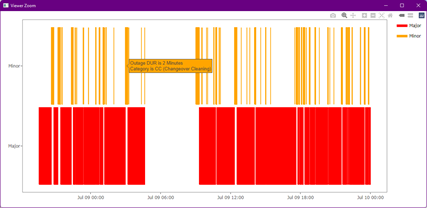
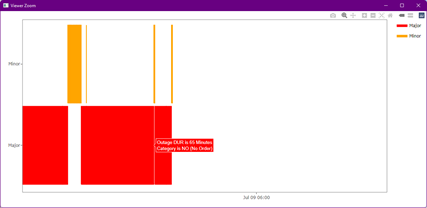
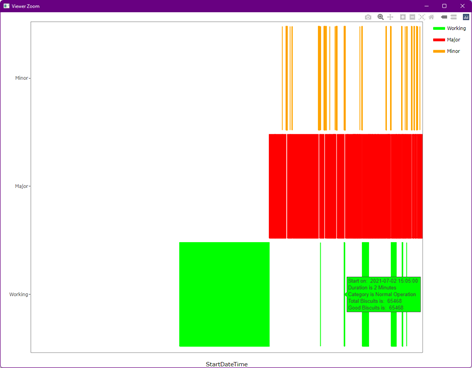
And to get this annotated with OEE Cat and Duration and zoomable but not as a dynamic visual in Power BI – these two images are from R Studio.
This view is missing the good or Working time – which should also have the Total and Good biscuit production values allocated and added to the tooltip. To show working time I need to add working rows to the Fact table. Will move the total and good biscuits produced to these rows.
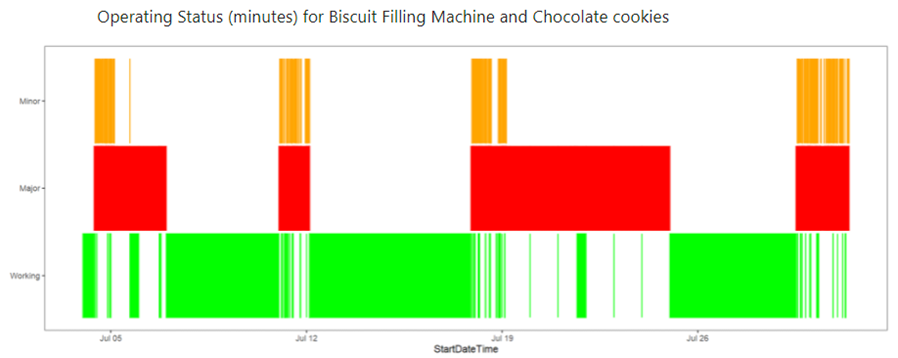
So, back to power query to create rows for working times. The query Fact2_good was the result and when merged back with Fact2_outage to get a table with rows for outages and for good production.
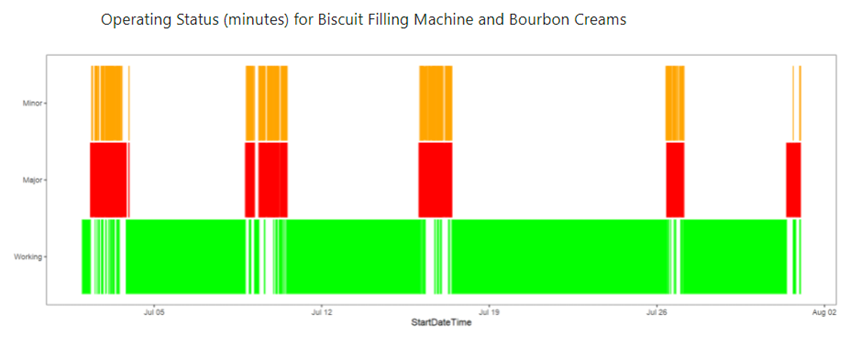
The Add Good tab visual now shows all three states for a particular selection of biscuit and machine.
The attached html is an active document (zoom and annotate from R Studio.) The figure shows one zoomed region.
test.html (5.5 MB)
However, this is not usable in the Power BI report. Off to look at Charticulator to see if it can be used to create this visualization with a play axis and zoom capability.
I did not finish this challenge – let myself get distracted chasing this visual. And I am confident my queries are rather ugly (and long), but I learned a lot getting here. Thanks for the challenge,
tim
StripChart.pbix (853.0 KB)
Hello Rachwen_Mesbehi,
I congratulate you for the fantastic work done on this dashboard, in terms of design and functionality. It is quite complete, not only does it have the factors on which the OEE depends, but you also analyzed the types of stops and the MT KPIs.
In my case, I am still struggling with the calculation of the formulas. After seeing the Dax calculations that you have made, I will tell you some questions that arise.
- In the calculation of the units produced, I have done it by subtracting the previous value from each record per machine and product, but for the first record I see that you use a random value between 800 and 1800. In my case, I did not know what to apply if zero or accumulated value. Having only the data of the stops and the accumulated ones, I think that it is not possible to calculate the real production.
- In the calculation of the stop times, I have done it at the day level but I have found the case that the stop time belongs to two days, for example if the machine is stopped for two hours from 11:00 p.m. until 1:00 a.m. the next day. Here we cannot add the duration but we have to calculate the part that corresponds to each day.
- The performance data is given to us by machine and product, so to calculate the performance at the speed of the contract, we should know the effective time that a machine is working on that product. We can calculate the downtime but I don’t know how to calculate the gross time available for each machine and product. I have considered that there is a machine for each product, with 24 gross hours, so for 07/01/2021 I get 7 machines with 168 gross hours.
Thanks a lot.
1 Like
-
A1 - I noticed that we have to many zero in the cumulativebiscuits colomn also in some cases we have the previous row is bigger than the next one this why I used RANDBETWEEN FUNCTION to add more sense to the oee measures
IF (
PrevRow = BLANK ()
|| NOT ( machines = 1 )
|| ‘Fact’[GoodMadeBiscuits] = BLANK ()
|| PrevRow > ‘Fact’[GoodMadeBiscuits],
RANDBETWEEN ( 800, 1800 ),
‘Fact’[GoodMadeBiscuits] - PrevRow
) -
A2-In some cases as you said, if the machine is off from 01-07-21 11 PM until 02-07-21 1 AM of the next day as per the downtime measure I created, the downtime will be added to the next day (two hours will be added to the total downtime of 02- 07-21)
FILTER (
‘Fact’,
OR (
AND ( ‘Fact’[StartDate] = MinDate, ‘Fact’[StartTime] >= StartTime ),
‘Fact’[StartDate] > MinDate
)
),
FILTER (
‘Fact’,
OR (
AND ( ‘Fact’[EndDate] = MaxDate, ‘Fact’[EndTime] <= EndTime ),
‘Fact’[EndDate] < MaxDate
)
But it would be better if we divide the downtime into two days ( 1 hour for 01-07-21 and 1 hour for 02-07-21 ) -
A3 -The total time available for one machine is 24 hours in a day, so if we have five machines running on that day, we should have 24 * 5 = 120 total hours on that day.
VAR Result =
DIVIDE( DATEDIFF ( MinDateSelected, MaxDateSelected, SECOND ),60,0)
RETURN
Result‘Availability Measures’[Machines Number]*
Thanks @jafernandezpuga for your lovely feedback !
4 Likes
Hi everyone,
This is my entry for Power BI Challenge 18.
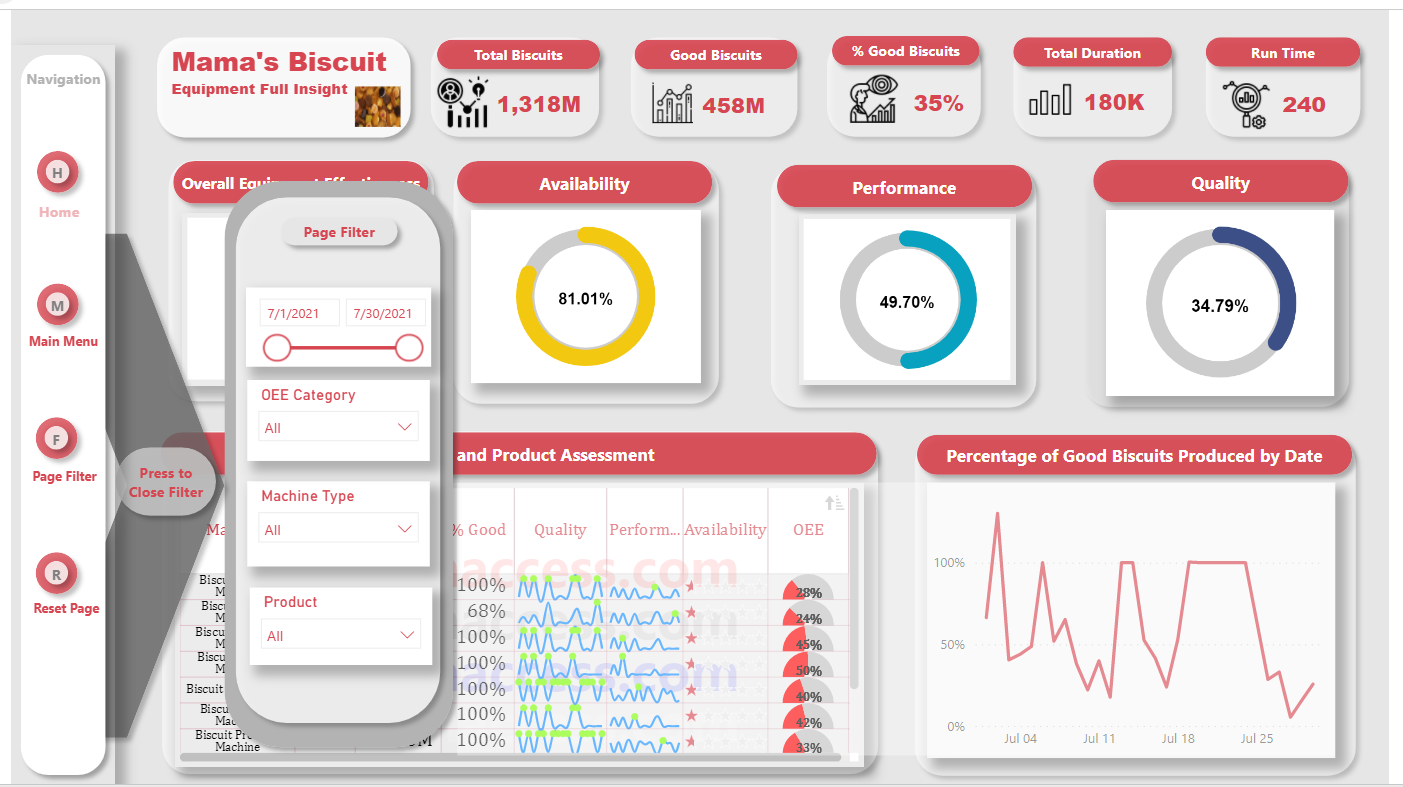

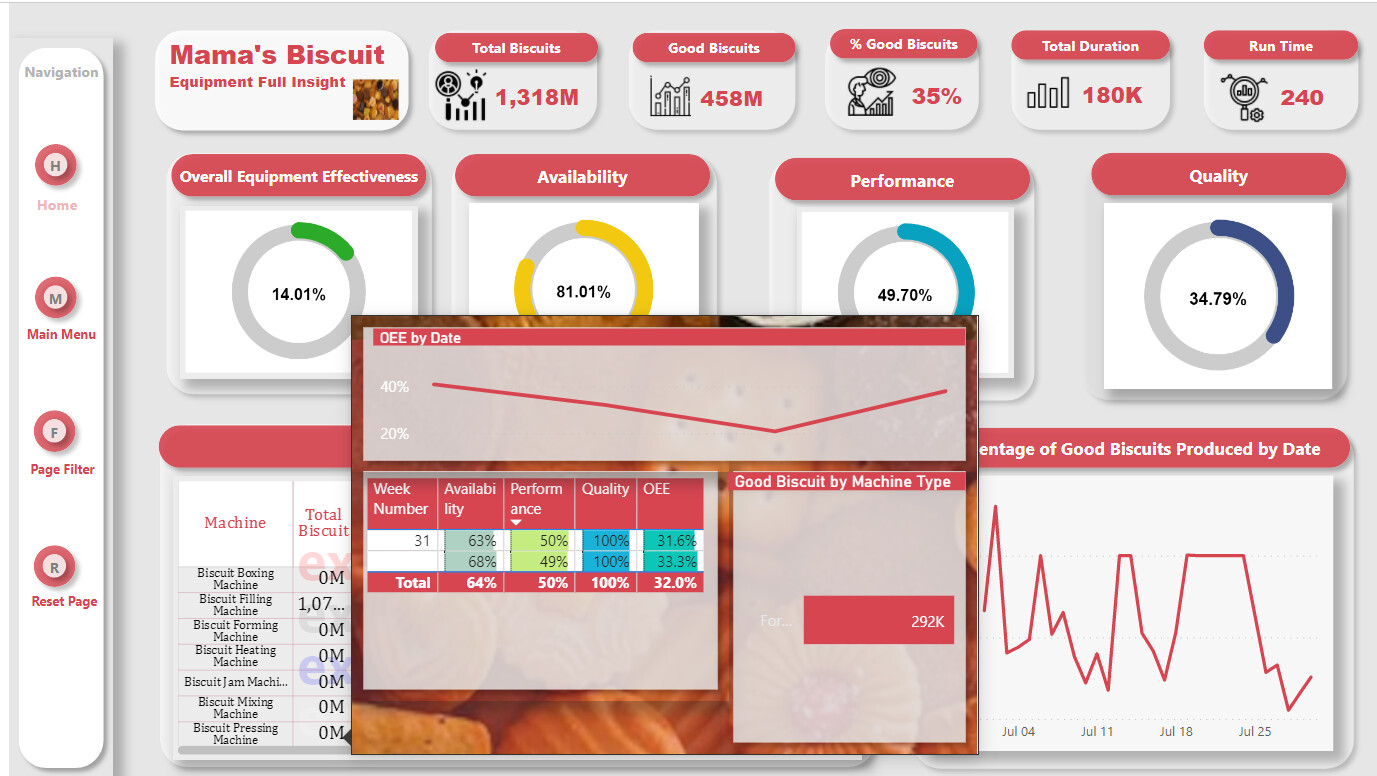
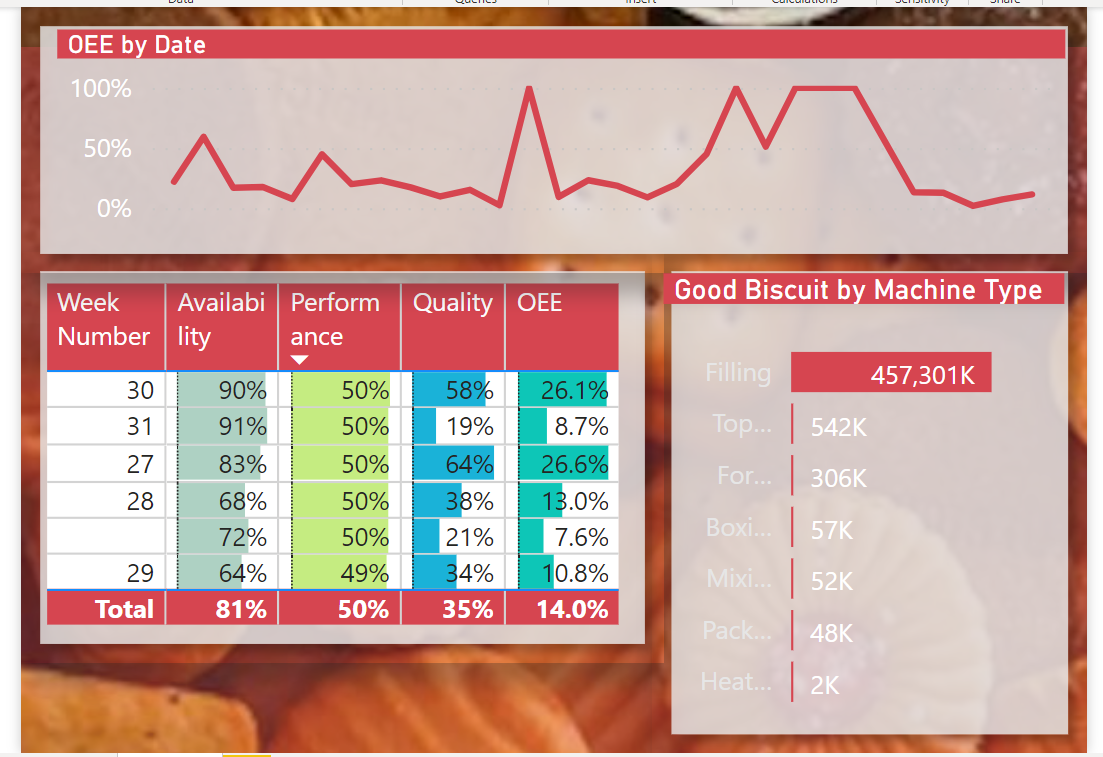
This current challenge introduced me to OEE. It was really fun trying to find my way out to get meaningful insight and then picking the suitable model, visual and theme for the challenge. However, here I am.
You can click here
or use this URL directly to view https://app.powerbi.com/view?r=eyJrIjoiYzFkOWJlNzgtZmMxOS00MDcxLWE4NDItMmMwMGMzMzgwYjY1IiwidCI6IjA2MzNmYTY1LTcwN2EtNDVmNy1hOTAwLTIxOTE2ZWMxNGRlOSJ9&pageName=ReportSectionc61443ac188526d463c0
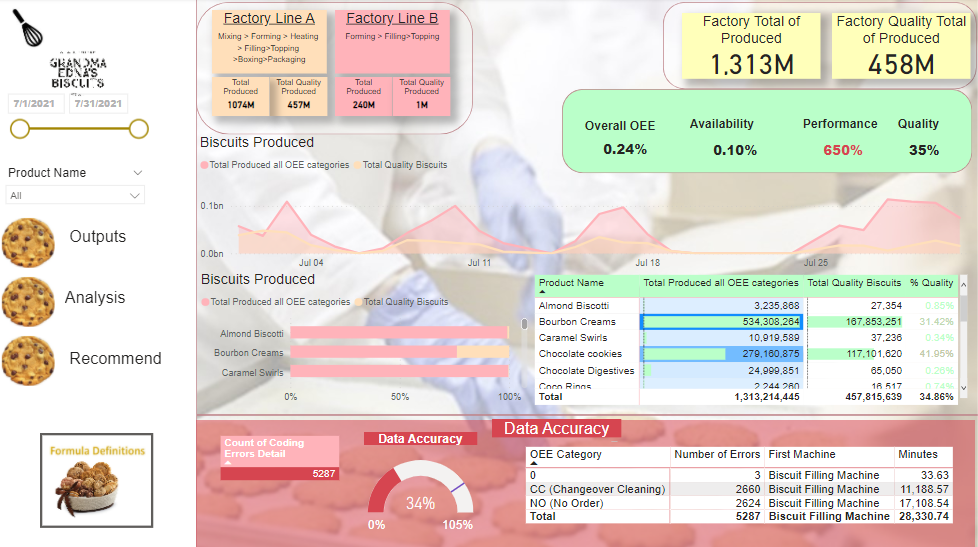
The OEE Calculation
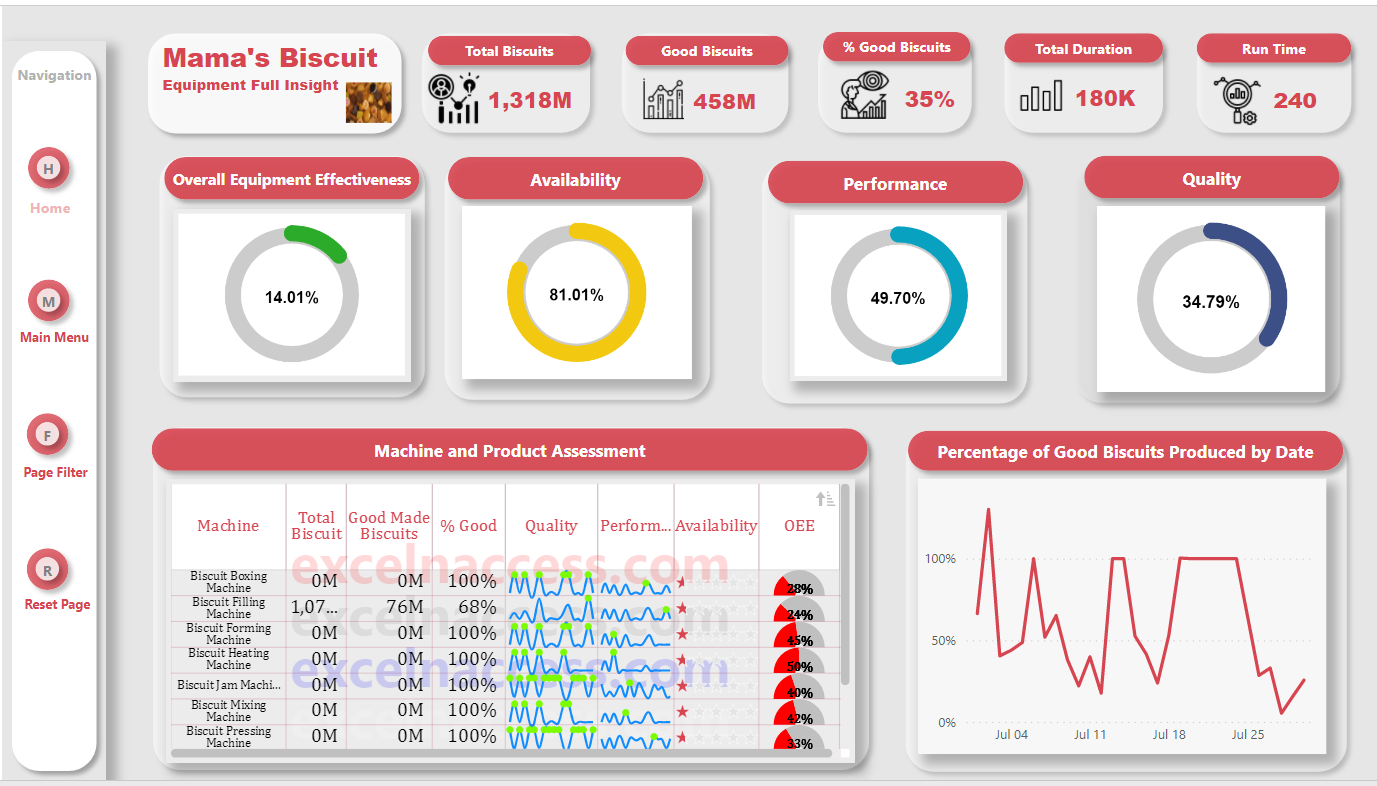
The preferred OEE calculation is based on the three OEE Factors: Availability, Performance, and Quality.
OEE Formula
OEE takes into account all losses, resulting in a measure of truly productive manufacturing time. It is calculated as:
OEE = [Performance] * [Quality] * [Availability]
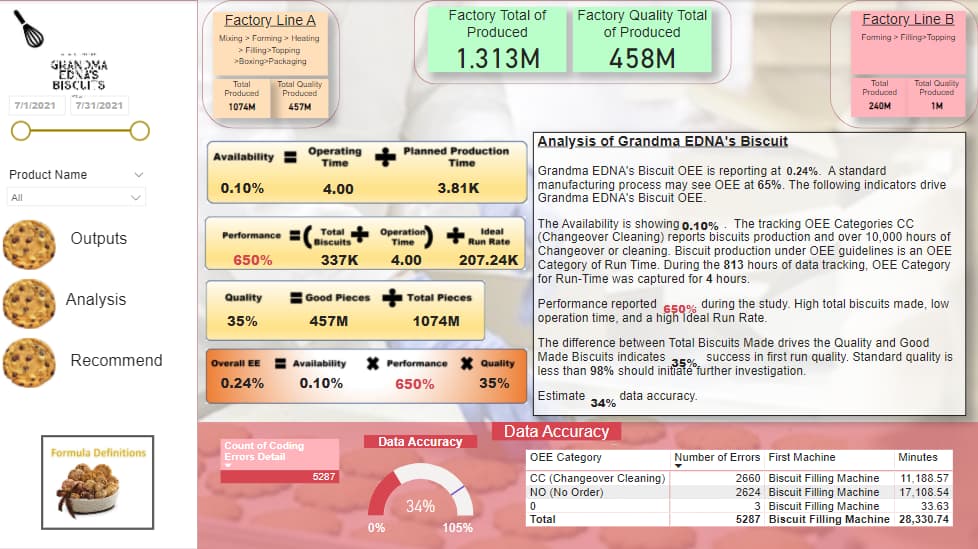
Availability
Availability takes into account all events that stop planned production long enough where it makes sense to track a reason for being down (typically several minutes).
Availability is calculated as the ratio of Run Time to Planned Production Time:
Availability = DIVIDE([No Order],[Total Duration],0)
Run Time is simply Planned Production Time less Stop Time, where Stop Time is defined as all time where the manufacturing process was intended to be running but was not due to Unplanned Stops (e.g., Breakdowns) or Planned Stops (e.g., Changeovers).
Run Time = CALCULATE([Total Duration], FILTER(‘Fact’,‘Fact’[OEE Category] = “Run Time”))
Performance
Performance takes into account anything that causes the manufacturing process to run at less than the maximum possible speed when it is running (including both Slow Cycles and Small Stops).
Performance is calculated as:
Performance = DIVIDE([No Order Total], [Total Biscuit], 0 )
Quality
Quality takes into account manufactured parts that do not meet quality standards, including parts that need rework. Remember, OEE Quality is similar to First Pass Yield, in that it defines Good Parts as parts that successfully pass through the manufacturing process the first time without needing any rework.
Quality is calculated as:
Quality = DIVIDE([Good Biscuit],[Total Biscuit],0)
2 Likes
Hello Rachwen_Mesbehi,
Thank you very much for your answer. I still have some questions:
Are the specific values of 800 and 1800 that you are using as arguments to the RANDBETWEEN function for some reason?
The last question was related to the calculation of performance. If it is considered that there is only one machine working on several products, in the following example, for the day 07/01/2021 the Biscuits Filling Machine has 24 hours of gross time and has worked on two products, Jammy Creams and Custards Creams, If we know that for Jammy Creams it has stopped for 2 hours and for Custards Creams 1 hour, how do we know how much gross time corresponds to each product in those 24 hours? Biscuits Filling Machine and Jammy Creams Effective Time = Biscuits Filling Machine and Jammy Creams Gross Time - Biscuits Filling Machine and Jammy Creams Stop Time. I would like to know how you have considered this topic or someone from the forum.
Thanks a lot,
1 Like
Hi @jafernandezpuga,
I chose the numbers 800 and 1600 randomly to add more logic to the calculation.
If you want to calculate the performance ratio of the machines , you should first calculate the Design Performance
Design Performance = Effective RuntimeDesign Speed (for each SKU)
And then the Performance% = Filled Consumer Units/Design Performance100.
You can find the design speed in the target speed table.
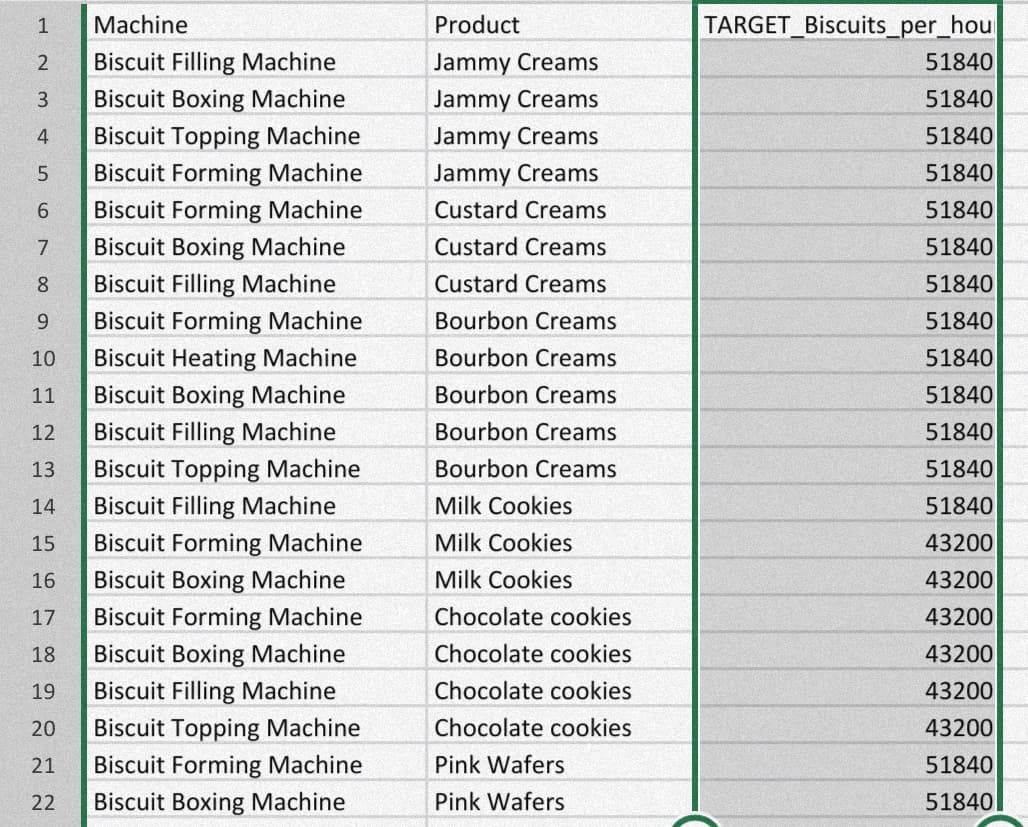
Lets take an example , for the Jammy Creams product the Biscuit Filling Machine can produce 51840 biscuits per hour (TARGET_biscuits_per_hour column), so per min the Filling machine can produce 51840/60 = 864 biscuits , lets calculate now the design performance for 2 mins
DP = 2 × 864 = 1728
The actual total biscuits made in 2 mins is 920 biscuits.
As a result of this, the Performance ratio will be
P% = 920 / 1728 ×100 = 53.24%.
Thanks !
1 Like
Hello Rachwen_Mesbehi,
I have the problem in calculating the effective time of a machine and a product when in one day the machine has worked on several products. Of the 24 gross hours you work in a day, what part of the gross time is allocated to each product? In the example, how do you calculate that this machine has worked 2 minutes of effective time on this product? You have to know the gross time that the machine has been working on that product and subtract the stops it has had, but I don’t know how to calculate the gross time of the machine and the product.
Thank you.
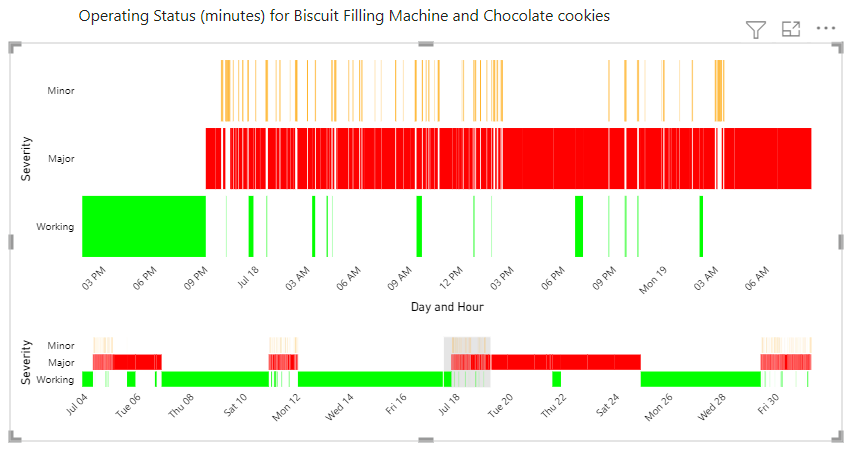
Updated with a new tab ‘try Deneb’ and now the visual supports zoom, pan and tooltips. This is much more useful as you can zoom into an interval and explore the outages, etc.
Use the mouse wheel to zoom in and pan around.
Started with the empty Deneb specification and built it up to:
{
  "$schema": "https://vega.github.io/schema/vega-lite/v5.json",
  "description": "An attempt at a chart recorder -like output",
  "data": {"name": "dataset"},
    "params": [{
    "name": "grid",
    "select": "interval",
    "bind": "scales"
  }],
  "mark": {
    "type": "bar"
  },
  "encoding": {
    "y": {
      "field": "Severity",
      "type": "ordinal",
	  "sort": ["Minor", "Major", "Working"]
    },
    "x": {
      "timeunit": "day",
      "field": "Start",
      "type": "temporal",
      "title": "Day and Hour",
      "axis": {
        "labelAngle": -45
        }
      },
    "x2": {
      "field": "End",
      "type": "temporal"
    },
    "color": {
      "field": "Severity",
      "type": "ordinal",
      "scale": {
        "domain": ["Working", "Major", "Minor"],
        "range": ["#00FF00", "#FF0000", "#FFA500"]
        }
      },
    "opacity": {
      "condition": {
        "test": {
          "field": "__selected__",
          "equal": "off"
        },
        "value": 0.3
      },
      "value": 1
    },
    "tooltip": [
      {"field": "Start", "type": "temporal", "timeUnit": "hoursminutes"},
      {"field": "Duration", "type": "quantitative"},
      {"field": "OEE Category", "type": "nominal"},
      {"field": "newTotalMade", "type": "nominal"},
      {"field": "newGood", "type": "nominal"}
      ]
  }
}
Likely a bit clumsy and need to rename some items, improve the tool tip, etc.
StripChart v2.pbix (2.1 MB)
Tim
Another way to pan and zoom is shown below. Select a region on the lower visual to highlight in the visual above - where tooltips provide additional detail on production and outages.
Tim
StripChart v2b.pbix (2.1 MB)
Tim, great idea to display the stoppage data on a strip chart!
I noticed in your deneb visual the following json validation issue. Are these showing in your visual as well?
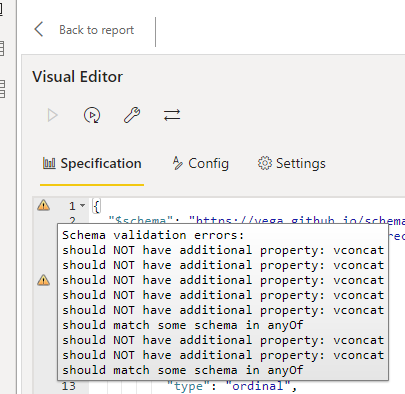
Thanks, Daran and yes I have all those errors. Likely an artifact of pasting a bunch of code fragments together - and I did not look a lot at the Config section - where I likely need to delete things I override in the specification.
I like this Deneb stuff - but have a lot to learn.
tim
1 Like
Playing with this a bit more, the schema validation errors appears when I add the “x2” definition for the end of the bar. Using the GANTT example the error appears when I define the x axis as temporal. It may be that I need to use a DUR to define the bar size (instead of start and end time)
I added these two examples to the example template tab.
StripChart v2c.pbix (2.1 MB)
1 Like
1 Like

Very nice report!
@EnterpriseDNA @Rachwen_Mesbehi entry zip file on the showcase is missing the pbix file:
OEE Data Report | Enterprise DNA
Please add the pbix file so we can all learn from this great report!
Thanks
Hello @Paul.Gerber @haroonali1000 Please share the pbix file to konw more about dashboard. Thanks in advance and please consider it on urgent basis
Hi @V_Baisla,
Welcome to the forum.
More about data and requirements you can find at the brief.
If you are look for some showcases - you can find at : https://app.enterprisedna.co/app/showcase
Hope it helps.
1 Like
Hi @V_Baisla people on this forum, by in large, volunteer in their free time so please don’t put time pressures on contributors, it is against the ethos of the forum.
1 Like