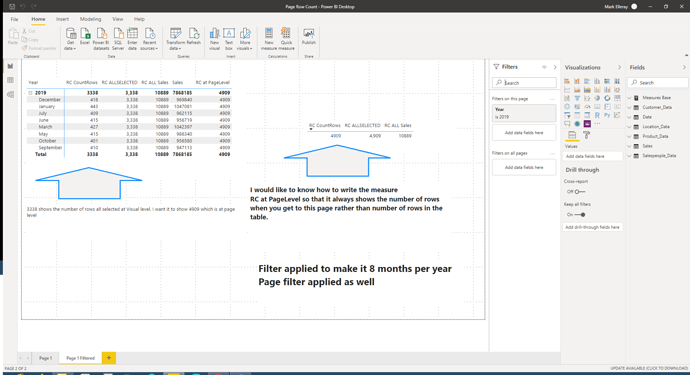
Data set size is 10889 (ALLSELECTED on Page 1)
Data size when you do all selected on Page = 4909 (ALLSELECTED on “Page 1 Fltered”)
There is another filter on the visual so ALLSELECTED is now 3338
Inside the visual I need a way to get to 4909 the rowcount at Page level.
Why ?
Because that visual is goint to have a complex slow calculation for cumualtive calciulation and potentially RANKX as well.
- Outside the visual at page contect will be a warning if the Page ALLSELECTED is > 4900 rows
- The complex and slow calculation will be = 0 if Page ALLSELECTED >4900 Rows
I dont want to put the warning up and then the calculation to be executed which is what happens currently.
Yes I do want to know what I can do with Measure RC at Pagel Level to show the correct number. This may be key to other pages in the report as well so that I can avoid or dop different visuals if the users selects a lot of data.
Everything is done bar getting the rpwcount for the page while within the visual context
Thanks
E
Hi @ells. I’ll look forward to other forum members commenting on this, as I’m still missing something and don’t see from the description why we can’t use the [RC Page Level] measure outside the visual. Anyone? Greg
Outside the visual is fine for displaying the message. Works a treat but the report will then show a message saying it will not do the calculations and the users will sit and watch as the visual takes ages while it is tryiung to do the calculations.
I am seeking consistency for the warning message and what happens. I have searched through Context references and tried different ways but cant see that it can be done. Eventually I suspect I may end up with four visuals each of which will probably contain the complex calculation. Each of which are likely to have differing data volumes. If the report goise out and half the calculations are there when the message say they are not the users will complain and start to question whats going on.
I think this will remain unresolved. The only alternative is to somehoe not do any visuals or calculations if the count of records for the page exceeds x
Thanks
E
Hello @ells
Can you try below:
RC REMOVEFILTER = CALCULATE(CountRows(Sales),REMOVEFILTERS(‘Date’[MonthName]))
@m.hossain
Awesome, Thats a step forward, better than where I am at the moment. That might just work as the filters on my visuals are added at build and it would only be when the users personalise the visualisations it would not work.
Definate step in the rioght direction
Thanks
E
Great, glad to hear that. I not clear regarding the personalize the visuals, I hope you are talking for about the inbuilt latest functionality in the powerbi to personalise the visuals at the end-user side, right?
In that case, user will just change the chart type and will drag and drop the measures/calculations you provide, so I think creatively you can limit something there so that end user will drag and drop the right measures.
