Hey Joe,
I would but I still can’t get the distribution graph to update based upon filters used. Still trying to work the kinks out, but I am in a holding pattern at the moment.
Hey Joe,
I would but I still can’t get the distribution graph to update based upon filters used. Still trying to work the kinks out, but I am in a holding pattern at the moment.
Hey CW
Did you ever get this done? if so how i have exact same issue! I see this is marked as a solution but i do not see one.
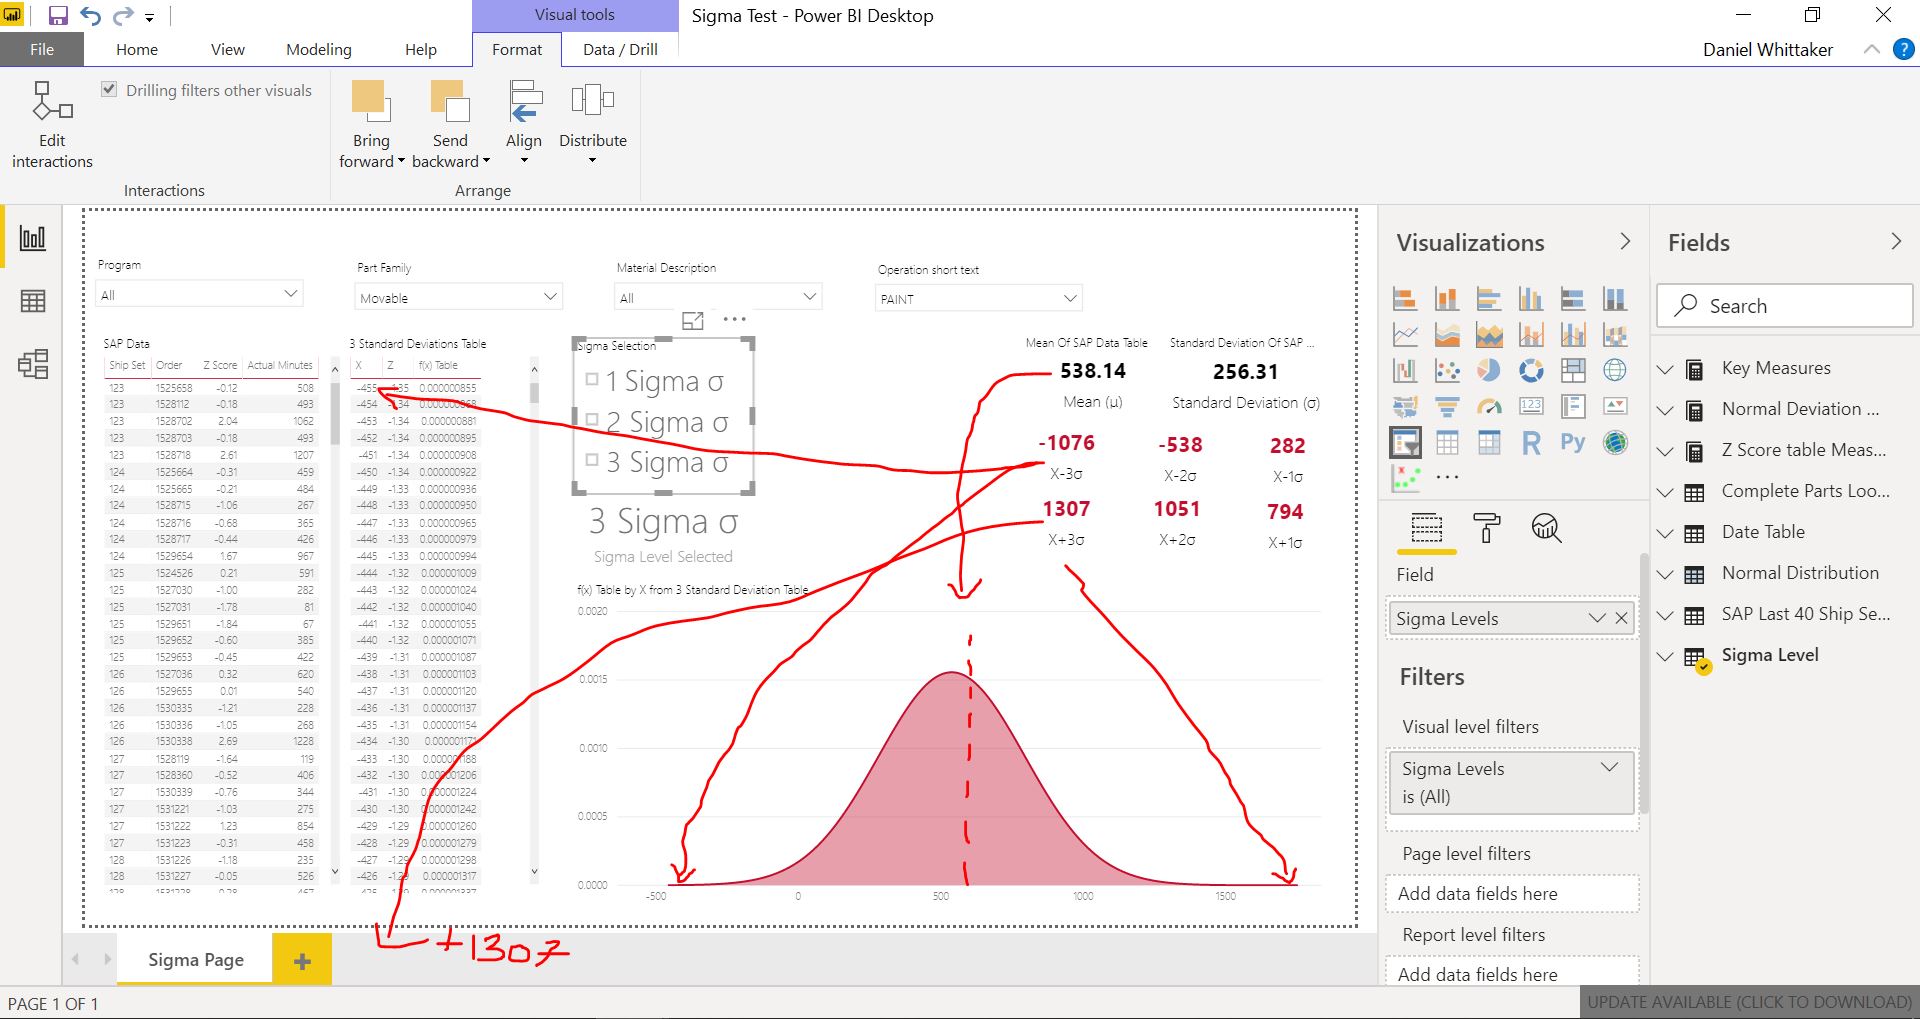
See Screen Shot i cannot get the 3 Standards Deviation table X value column to take the Floor value as my current filtered X - 3 Sigma value and my Ceiling value as X + 3 Sigma value.
Its always looking at the full data set and taking those values because i used a calculated table i assume. As you can see by the bell curve the Mean (Top of the bell) is out of position because it thinks the Floor is -455 and Ceiling is +1750 Which is true for the full data set but not for my filtered data set shown in the SAP data table.
How can i write the same formula as below that i used to create a calculated table as a Dax measure and create a virtual table?
Normal Distribution =
VAR MinNumber = FLOOR([X-3σ],1)
VAR MaxNumber = CEILING([X+3σ],1)
RETURN
SELECTCOLUMNS (
CALENDAR ( MinNumber, MaxNumber ),“X”, INT ( [Date] ) )
I also uploaded my PBIX file.
Sigma Test.pbix (461.5 KB)
Many Thanks
Dan