Hello @jdibari,
Thank You for posting your query onto the Forum.
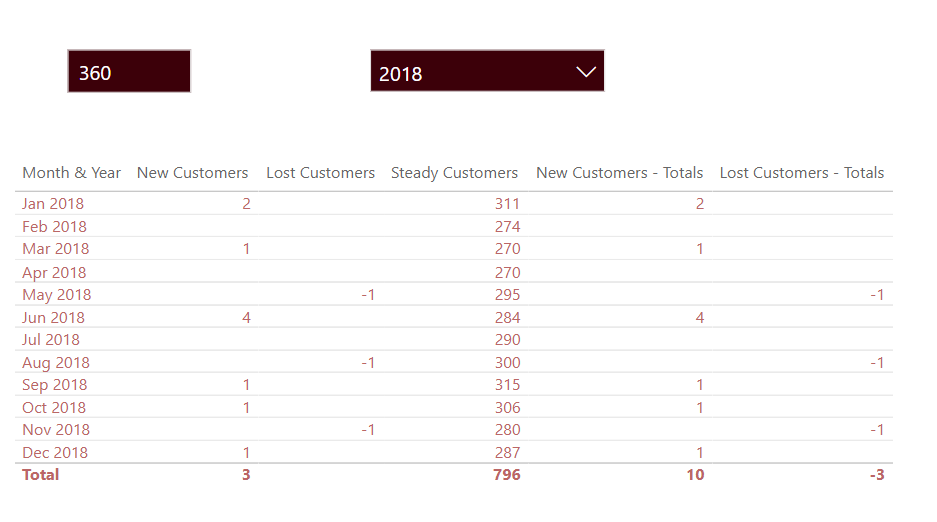
Well, it’s just a totalling issue/error and this similar type of topics has been addressed quite a few times onto our Forum. Just write the below provided measures and you’ll see the correct totals.
New Customers - Totals =
SUMX(
    SUMMARIZE(
        Dates ,
        Dates[Month & Year] ,
        "@Totals" ,
        [New Customers] ) ,
    [@Totals]
)
Lost Customers - Totals =
SUMX(
    SUMMARIZE(
        Dates ,
        Dates[Month & Year] ,
        "@Totals" ,
        [Lost Customers] ) ,
    [@Totals]
)
I’m also attaching the working of the PBIX file as well as providing a link of the post which our expert had created on this very topic for the reference purposes.
Hoping you find this useful and meets your requirements that you’ve been looking for. ![]()
Thanks and Warm Regards,
Harsh
New Customer Analysis - Harsh.pbix (465.1 KB)