Need to create drilldown for data within a time period

So - the Date hierarchy is great for drilling down. But what if I want to drill into the actual records that comprise my data for a given period? For instance - Sales by Week: What if I want to call up the actual records of sales from my source data for a given week from my report? Is there a tutorial that has already been provided for this scenario? Thank you.

This should be super easy if you set up your model correctly.

Can you provide more information about your model and how you want this to work in your report.

A demo Power file would be helpful.

But really all you’re doing here is using the natural context coming from date filters. If you have your date table linked to you fact table this should be easy.

Maybe you can also clarify what you mean exactly by drill down because they could mean many things,

Just a bit more info here and this should be solved quickly

Sam

Hello @kjssdca,

Thank You for posting your query onto the Forum.

Since you’re using the drill down options of the date hierarchy. By default in that, we don’t the option which enables us to select the option of “Week”. Below is the screenshot provided for the reference -

Date Hierarchy - 1

But you can definitely start creating your own custom hierarchy by clicking on the “” dots ellipses and then selecting the option of “New Hierarchy”. Below is the screenshot provided for the reference -

And then just drag and drop the fields that you want in your hierarchy levels. I’m presuming that you want to analyze it on “Day of Week Name” basis so I’ve created my hierarchy level accordingly. Below is the screenshot provided for the reference -

Date Hierarchy - 3

Now, once the hierarchy levels are created as per the requirements. You can create a chart and the result shall be as per the screenshot provided below -

Please Note: The above result shows upto the last drillthrough level as per the hierarchy created.

I’m also attaching the PBIX file of my working for the reference.

Hoping you find this useful and helps you in creating the hierarchy that you’re looking for. :slightly_smiling_face:

Thanks & Warm Regards,
Harsh

Hierarchial Data.pbix (674.2 KB)

Hello @kjssdca,

Also if you’re looking to analyze based on the “Week Numbers” below is the screenshot provided for the reference -

Also attaching the PBIX file of my working for this part of the solution for the reference.

Thanks & Warm Regards,
Harsh

Hierarchial Data.pbix (667.2 KB)

I have two data points that are time-based in my report. (See attached.) I want to drill through to the actual records that make up the data points. I looked at the Microsoft article on this topic and I have the pages created in my report with the tables that I want to drill through to, but the simple right-click function mentioned in the Microsoft article isn’t working here. Here are the correspondencies:

No. of Closed Contracts - Closed Sales Detail
No. of New Clients - New Clients Detail
Uploading the .pbix file.Zoho Sales POC_v5.1.pbix (1.3 MB)

@kjssdca, @Harsh,

Harsh asked me to look at your question, since his company has not yet updated their version of Power BI, and thus he was not able to open your file.

Unfortunately, drillthrough is not going to work as you desire, since that functionality requires selection of a unique value for the drill through field. Thus, trying to drill through on date is not an option, since your “No. Of Closed Contracts” measure does not result in the identification of a unique date . Conversely, if we use user full name as our drill through field, it works fine because each row of the lower table uniquely identifies a user:

The only way I can think of as to how you can accomplish what you’re trying to do is to:

  1. Set up slicer(s) on your Weekly Sales page to filter down to the closed contracts
  2. Copy that slicer(s) to your Closed Sales Detail page. When it asks whether you want to sync the slicers between pages, answer yes.
  3. Now go back to the Weekly Sales page, and add a blank button, then add text to that button – something to the effect of “Go to Details Page”
  4. Add a page navigation action to that button that brings you to the Closed Sales Detail page when you click on it.

I hope that’s helpful. Please give a shout if you still have questions.

  • Brian
3 Likes

Hi @kjssdca, did the response provided by the contributors help you solve your query? If not, how far did you get, and what kind of help you need further? If yes, kindly mark the thread as solved. Thanks!

@BrianJ, I’ve had a chance to look at this solution. I’m stuck on Step 1. Is there a reference you could send me to so I can see what that looks like? Also, would you be so kind as to remove the table screenshot from your last response - it contains real info that I would prefer not having out for all to see. Thank you so much and sorry for my ignorance here.

@kjssdca,

I can’t find a specific reference to send you, but I’d be glad to work up a mock-up version for you tonight that illustrates the approach I was recommending.

Also, I kept the screenshot in the post, but blurred out all the data - is that OK?

  • Brian

Thanks @BrianJ, Yes to both offers, thank you!

@kjssdca,

Okay, attached is a “proof of concept” mockup. I’m not sure these are exactly the correct slicer configurations, but they should illustrate the points. There are a lot of fiddly little steps in this process, but none particularly difficult. Here’s how I built the mockup:

  1. Added a date slicer based on Start of Wk Display field, and a list slicer based on Contract Status to the Weekly Sales page

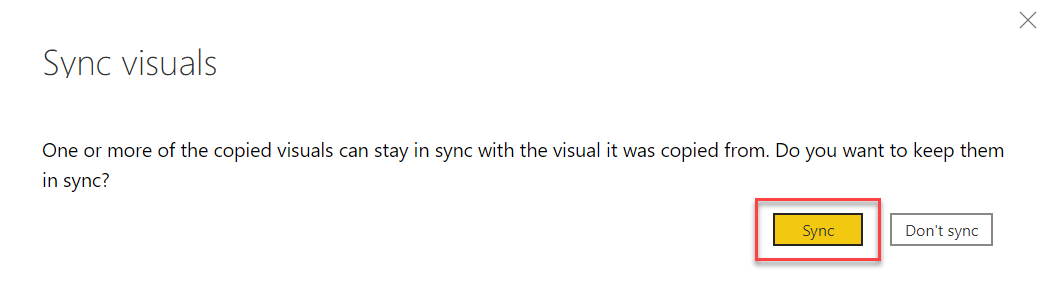
  2. Copied each of the slicers to the Closed Contract Detail page. Selected “Sync” in each case when I pasted to the destination page:

  1. Added a blank button to the Weekly Sales page, next to the slicers and set the action for that button to “Page Navigation”

  2. Created three very similar measures to control a) the page navigation destination page; b) the blank button text; and c) the blank button background color. Here’s the measure for the page navigation destination page – the others are almost identical, except for the values they return at the end if the statement is true versus false. The statement evaluated triggers true if any of the “confirmed” contract status options is selected in the list slicer, false otherwise.

    Page Nav Button =

    SWITCH(TRUE(),
        CONTAINSSTRING(
            CONCATENATEX(
                VALUES(Potentials_001[Contract Status] ),
                Potentials_001[Contract Status],
                ",",
                Potentials_001[Contract Status],
                ASC
            ),
            "Confirmed"
        ),        
        "Closed Sales Detail",
        "Weekly Sales"
    )
    
  3. Then set the page destination, button text and button background conditional options based on the measures created above.

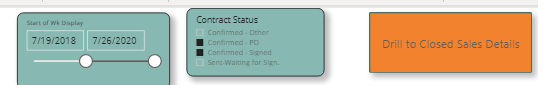
  4. At that point, we now have the button configured to look like this if one or more of the “confirmed” status options are selected and set to drill through to the Closed Contract Details page:

image

And configured to look like this if only the “Sent Waiting for Sign” option is selected:

image

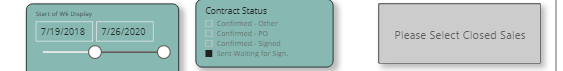
In addition, in the latter case page navigation destination is set to the current page, so even if the user clicks on the button when it is grayed out, nothing will happen.

  1. Finally, on the Closed Contract Details page, I added another page navigation button - this one a “back” button returning the user to the Weekly Sales page

I hope this is helpful to you. Full solution file attached so you can delve into the details of the other measures and look at all the configuration options necessary to make this work. If you use a nice button template and good conditional background and font color options, you can create a really good-looking, smooth user experience.

2 Likes