Hi @myassay75,
One observation, you have a massive Date table, if at all possible restrict that to the number of years you actually require. Because some calcs are now iterating over a very large Date table.
You could for example set up a dynamic start- and enddate for your date table, here’s more on that.
Next I created a couple of measures:
This calculates the last ProductPlanning[Date ] with an inventory value.
LastStockDate =
    CALCULATE( LASTDATE( ProductPlanning[Date ] ),
        FILTER( ALL( ProductPlanning ),
            ProductPlanning[Current inventoery ] <>0 &&
            NOT( ISBLANK( ProductPlanning[Current inventoery ] )) &&
            ProductPlanning[Date ] <= MAX( viewDates[Date] )
        ))
This returns that Inventory value
Inventory =
CALCULATE( SUM( ProductPlanning[Current inventoery ] ),
    FILTER( ALL( viewDates ), viewDates[Date] = [LastStockDate]
))
Used a cumulative pattern for Demand
Cum Demand =
VAR InventoryDate = [LastStockDate]
VAR ThisDate = MAX( viewDates[Date] )
RETURN

CALCULATE( SUM( ProductPlanning[Demand ] ),
    DATESBETWEEN( viewDates[Date], InventoryDate, ThisDate )
)
And for Replenishment
Cum Replenishment =
VAR InventoryDate = [LastStockDate]
VAR ThisDate = MAX( viewDates[Date] )
RETURN

CALCULATE( SUM( ProductPlanning[On Order ] ),
    DATESBETWEEN( viewDates[Date], InventoryDate, ThisDate )
)
Finally
Current Inventory level =
    [Inventory] - [Cum Demand] + [Cum Replenishment]
.
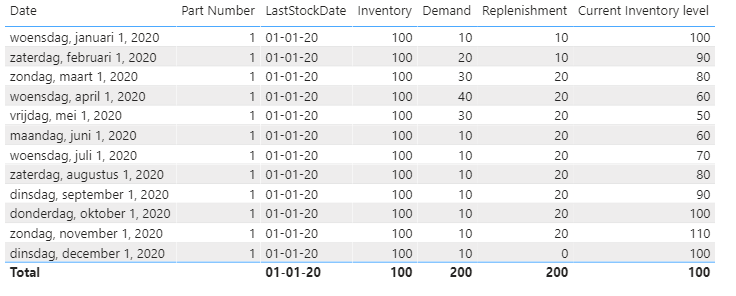
With this result.
This is based on your illustration of having only one initial stock position.
Here’s my sample file. I hope this is helpful.
eDNA - MPT Tool Test_Share.pbix (711.3 KB)
