Most Recent Date for Each Region

I have a table which contains monthly metrics data for six different metrics across four regions. I want to be able to display the latest values for each metric for each region in a table. The totals row shouId have the average value of all items displayed in each column. feel like it should be easy, but the solution is eluding me this afternoon.

NOTE:

  • Region 3 only has dates for Feb, so it should show Feb values in the table.
  • All other regions have dates for both Feb and March, so they should show only the March values in the table

I have included a PBIX file showing the data and a couple of things I’ve tried so far, but all I’m getting so far is the average of all values for each region/metric.

Thanks in advance for the help. Sorry if my description of the issue is not sufficiently detailed.

eDNA Demo 4.pbix (85.2 KB)

If you’ve got other solutions, I’d love to hear them, but I think I was able to achieve what I was after by changing the [As Of Date] measure as follows. I can’t claim to completely understand it, but it works.

As Of Date (old) = 
    STARTOFMONTH(
        LASTDATE(Dates[Date])
    )

As Of Date (new) = 
    CALCULATE(
        STARTOFMONTH(
            LASTDATE(Data[Date])
        ),
        ALLSELECTED()
    )

Hello @DaveC,

Thank You for posting your query onto the Forum.

Well, I tried both of the formulas that you’ve provided to achieve the “Most Recent Date For Each Region”. And it’s providing a bit vague results in terms of dates for each region. Below is the screenshot of the result provided for the reference -

As per “As of Date (Old)” measure, it’s providing the date result as “01-12-2021” whereas “As of Date (New)” measure it’s providing all the date results as “01-03-2021” this would have been correct had all the regions had the same date. But for “Region 3” you’ve the end date as “01-02-2021” so not sure how it’s evaulating the correct results in your file. If you select “Region 3” in a slicer than “yes” it does evaluate to correct result. Below is the screenshot of the result provided for the reference -

image

If you remove the slicer selection than all the results are evaluated to “01-03-2021” which is not appropriate.

Rather than writing long and complicated formulas to achieve the “Most Recent Date For Each Region” you can write one small and short formula as provided below -

As of Date - Harsh = 
MAXX( Data , Data[Date] )

Now, in the above screenshot you’ll observe that although I haven’t made any slicer selection the formula is evaluating correct results for the “Region 3” which has end date as “01-02-2021” rather than “01-03-2021”.

Lastly, to calculate the “Total Value” as per “Most Recent Date For Each Region”. You can use the below provided formula -

Total Value of Recent Month = 
CALCULATE( SUM( Data[Value] ) , 
    FILTER( ALL( Dates ) , 
        Dates[Date] = MAXX( Data , Data[Date] ) ) )

And than write the measure to correct the “Grand Total’s” -

Correct Totals = 
SUMX(
    SUMMARIZE(
        Data , 
        Data[Region] ,
        Data[Metric] , 
        "@Totals" , 
        [Total Value of Recent Month] ) , 
    [@Totals]
)

I’m also attaching the working of the PBIX file for the reference.

Hoping you find this useful and meets your requirements that you’ve been looking for. :slightly_smiling_face:

Note: To review the measures that I’ve created go to the “Key Measures - Harsh” folder.

Thanks and Warm Regards,
Harsh

Most Recent Date For Each Region - Harsh.pbix (84.2 KB)

1 Like

Hi @DaveC, did the response provided by @Harsh help you solve your query? If not, how far did you get and what kind of help you need further? If yes, kindly mark as solution the answer that solved your query. Thanks!

Hi @DaveC, we’ve noticed that no response has been received from you since the 12th of March. We just want to check if you still need further help with this post? In case there won’t be any activity on it in the next few days, we’ll be tagging this post as Solved.

Hi @DaveC, a response on this post has been tagged as “Solution”. If you have a follow question or concern related to this topic, please remove the Solution tag first by clicking the three dots beside Reply and then untick the check box.

We’ve recently launched the Enterprise DNA Forum User Experience Survey, please feel free to answer it and give your insights on how we can further improve the Support forum. Thanks!

@Harsh, Thank you for the help! I’m not sure why my solution seems to be working fine in the more complex data model that I have in my actual use case, but I will definitely study yours and see how I can apply it to mine.

Thanks again!

@DaveC,

Let me propose a totally different approach here that I think is much easier. The Power Query Group By function eats these sorts of grouping and aggregation problems for breakfast. Watch how simple this is:

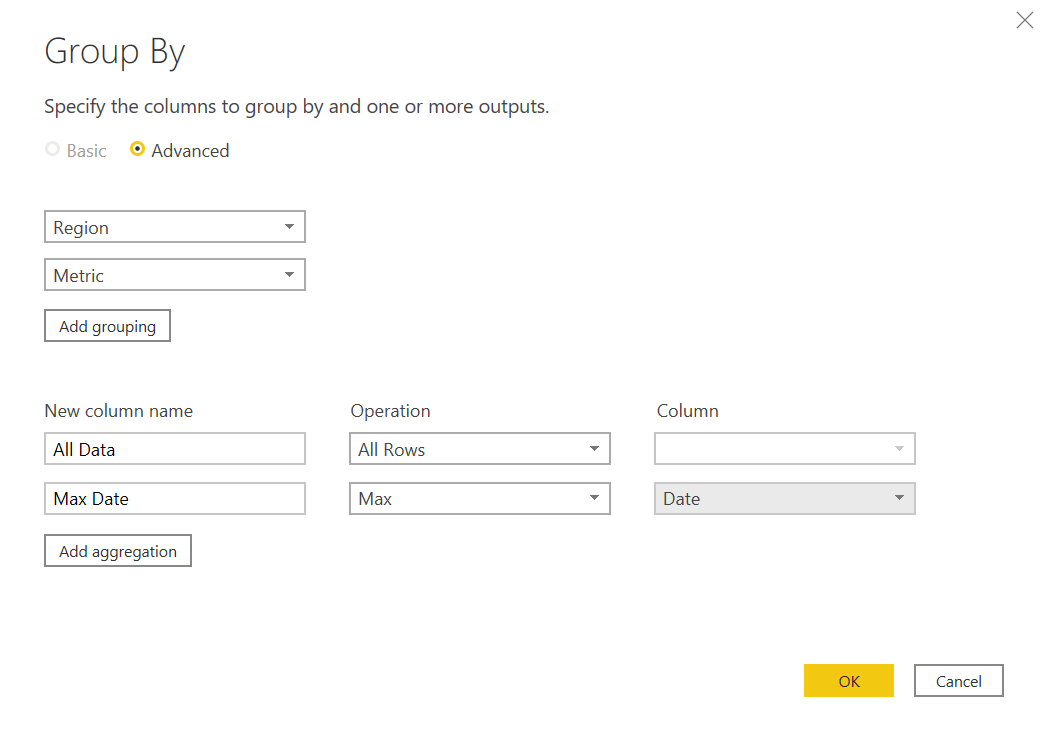
Then just create a column that subtracts Date from Max Date, and filter out any records where the difference is nonzero. Here’s the full M code:

let
    Source = Data,
    #"Grouped Rows" = Table.Group(Source, {"Region", "Metric"}, {{"All Data", each _, type table [Region=nullable text, Date=nullable date, Metric=nullable text, Value=nullable number]}, {"Max Date", each List.Max([Date]), type nullable date}}),
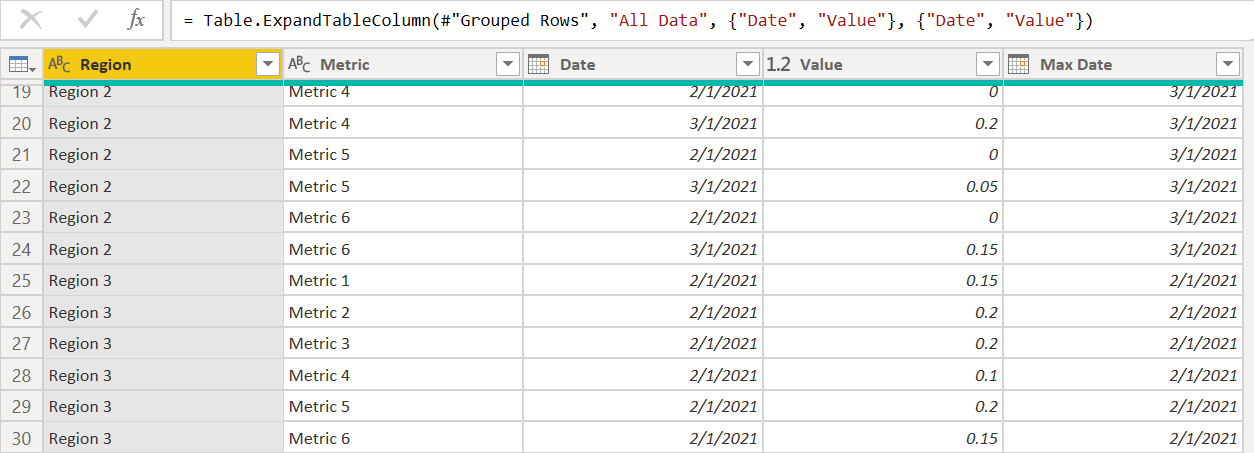
    #"Expanded All Data" = Table.ExpandTableColumn(#"Grouped Rows", "All Data", {"Date", "Value"}, {"Date", "Value"}),
    #"Inserted Date Subtraction" = Table.AddColumn(#"Expanded All Data", "Subtraction", each Duration.Days([Max Date] - [Date]), Int64.Type),
    #"Filtered Rows" = Table.SelectRows(#"Inserted Date Subtraction", each ([Subtraction] = 0))
in
    #"Filtered Rows" 

Now just drop the relevant fields from the resulting table into a matrix visual and boom!

image

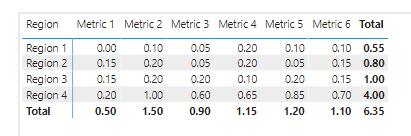
You can use the approach in the following post to force your totals to be averages for either rows, columns or both

I hope this is helpful. Full solution file attached below.

FYI – I’ve become totally enamored of the power and flexibility of the Group By function. Actually have a video on this coming out on Monday showing some additional applications of it.

– Brian
EDNA Forum – Region Metric Solution.pbix (87.6 KB)

1 Like