Modified Bullet chart for benchmarking

Trying to create a visual that shows the following

  • I have 5 KPIs that I am looking to have a bullet type charts for in a vertical list. The bullet will have a range of all our profit centres so that we can benchmark the selected profit centre
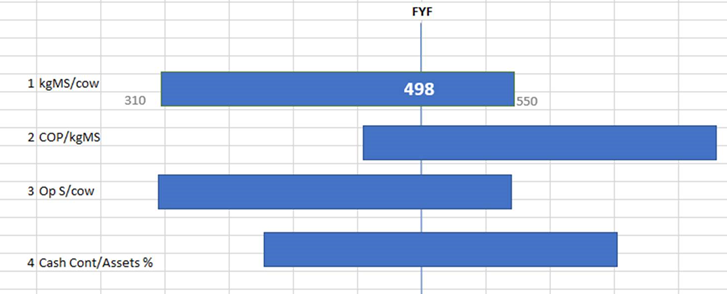
  • What I am looking to do is to have a marker that shows the position of the filtered company and the bullet would shift across the page to reflect where it might sit (see the visual below)

is this possibile?

This isn’t super easy to do exactly like this.

But have you checked out the techniques covered here in the project management workshop.

There’s a lot of cross over to what you’re looking to do.

This is the only real way to do this visual without some sort of custom one.

Have a good review of this.

Thanks
Sam

As Sam mentioned the last resort is to create a custom visual yourself, if that is the only path open to you have a look here for available options:

Charticulator documentaton: https://charticulator.com/docs/getting-started.html

1 Like