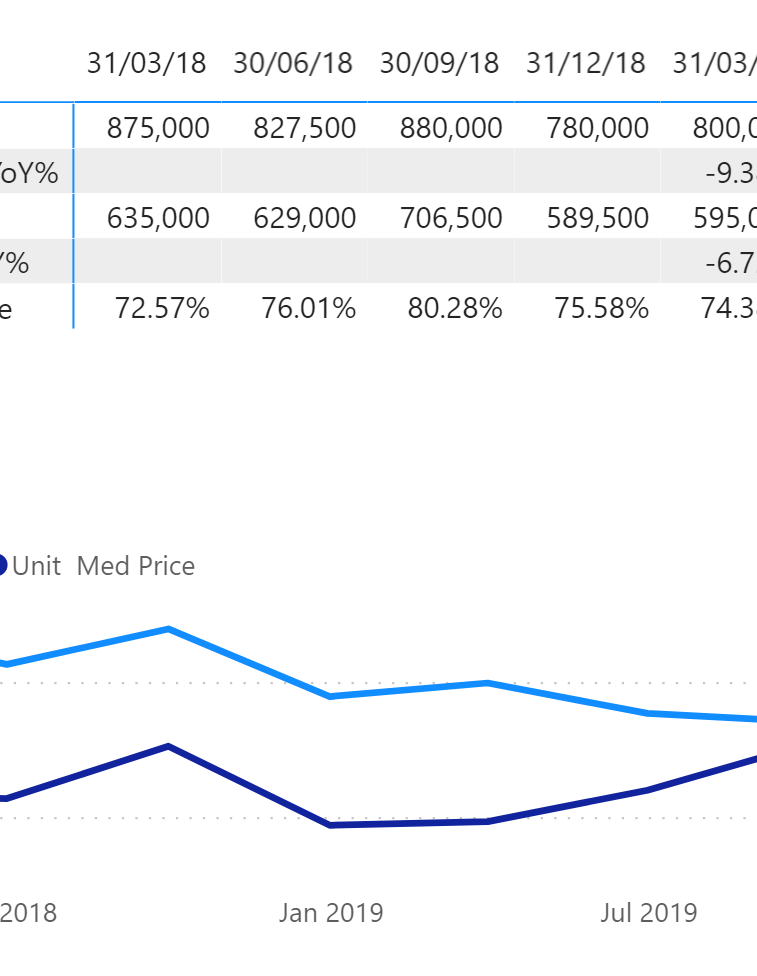
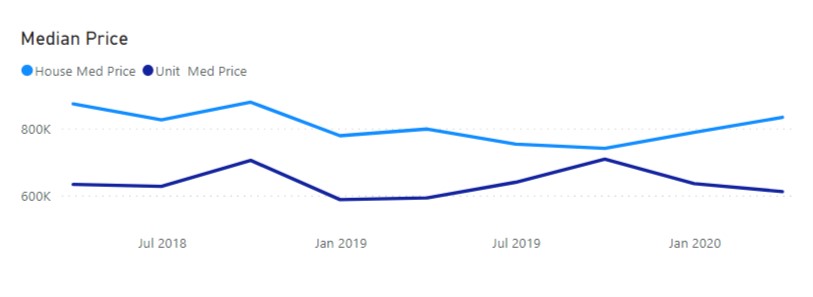
I have built a matrix and chart using almost identical data. The data are median prices for houses and units (flats/apartments) in various localities. The data points are quarterly and I have used the last day of each quarter for the date.
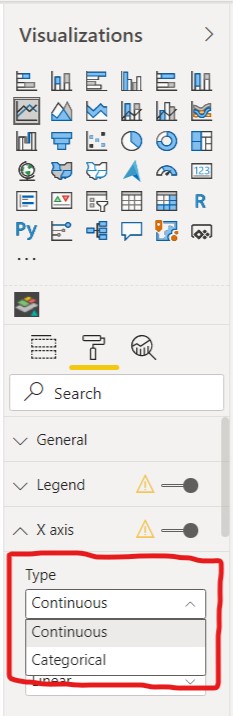
The problem, as can be seen in the attached image ,is that dates are displaying correctly on the matrix (in dd/mm/yy format) , but are displaying in a month year fomat, and the wrong month at that, in the chart. Further, the dates are showing correctly in the tooltips on the chart. I expect that the dats and format on the chart would be identical with the matrix.
Could someone please explain what is happening and provide a fix.
Hi @MIchaelGordon, we aim to consistently improve the topics being posted on the forum to help you in getting a strong solution faster. While waiting for a response, here are some tips so you can get the most out of the forum and other Enterprise DNA resources.
Use the forum search to discover if your query has been asked before by another member.
When posting a topic with formula make sure that it is correctly formatted to preformated text </>.
Use the proper category that best describes your topic
Provide as much context to a question as possible.
Include demo pbix file, images of the entire scenario you are dealing with, screenshot of the data model, details of how you want to visualize a result, and any other supporting links and details.
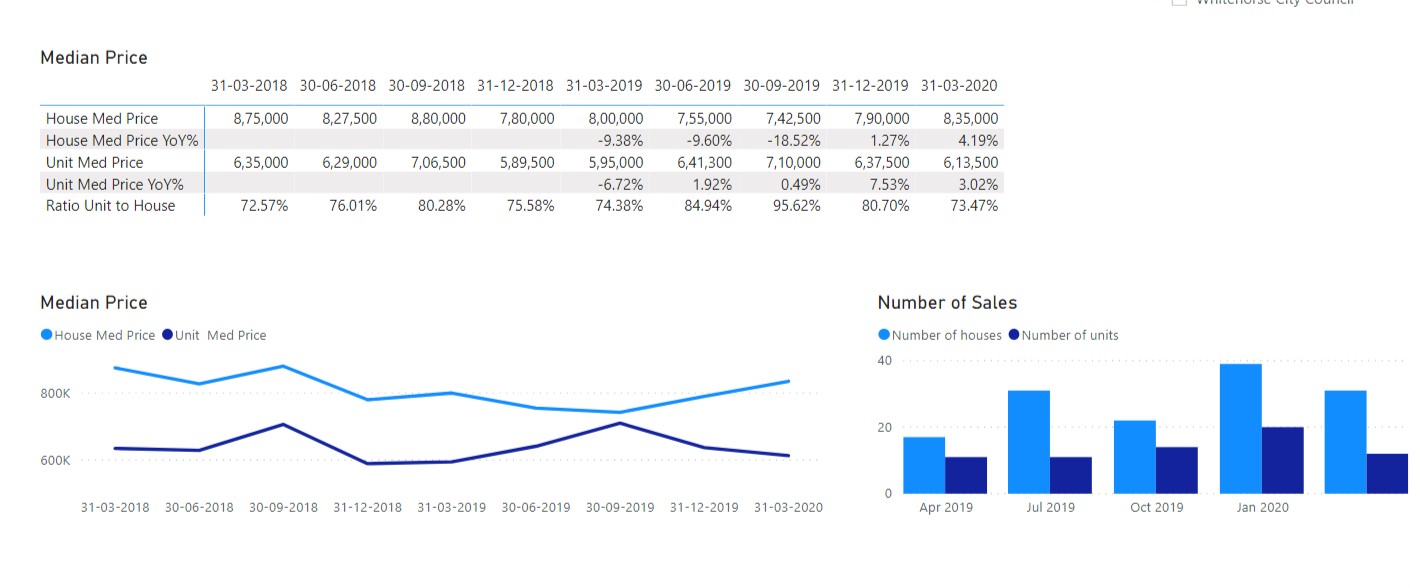
Lastly, I don’t see or observe any discrepancies in the “Month Order” as you’d mentioned it as follows in your post above that they’re displaying “Wrong Month”. In the given screenshot they show correct numbers.
I’m also attaching the PBIX file of the working for the reference.
Hoping you find this useful and meets your requirements that you’ve been looking for.