Hi Sam,
I think I am going to have to take it as it is as am running out of time. I need to have this finished by the middle of this month and have a lot to do.
Based on this result, I have the next interesting challenge.
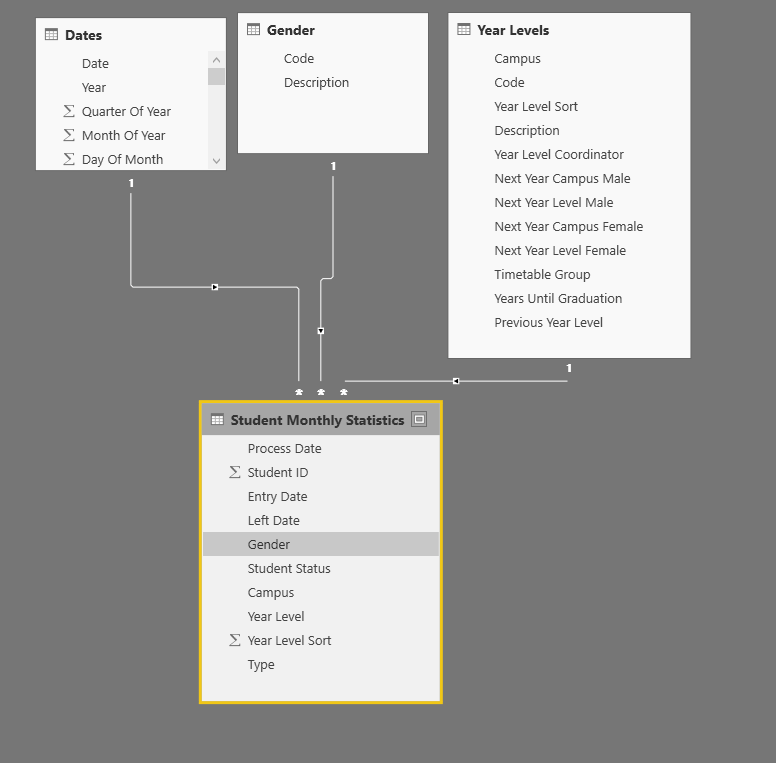
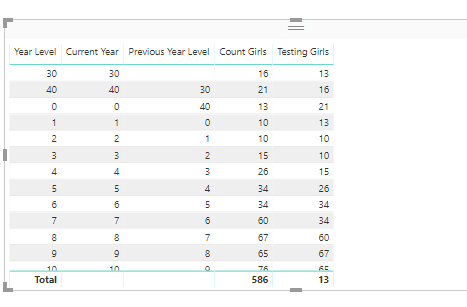
I have a second fact table, this time regarding historical entrant data. I have summarised that into a matrix quite happily and even got a correct sum at the bottom thanks to your getting the totals correct. (Didn’t quite get the line totals right but I don’t need them).
Note that is using a different year filter from the other calculations. I might need to remove this and put it in the actual measures as a parameter to make it work properly .
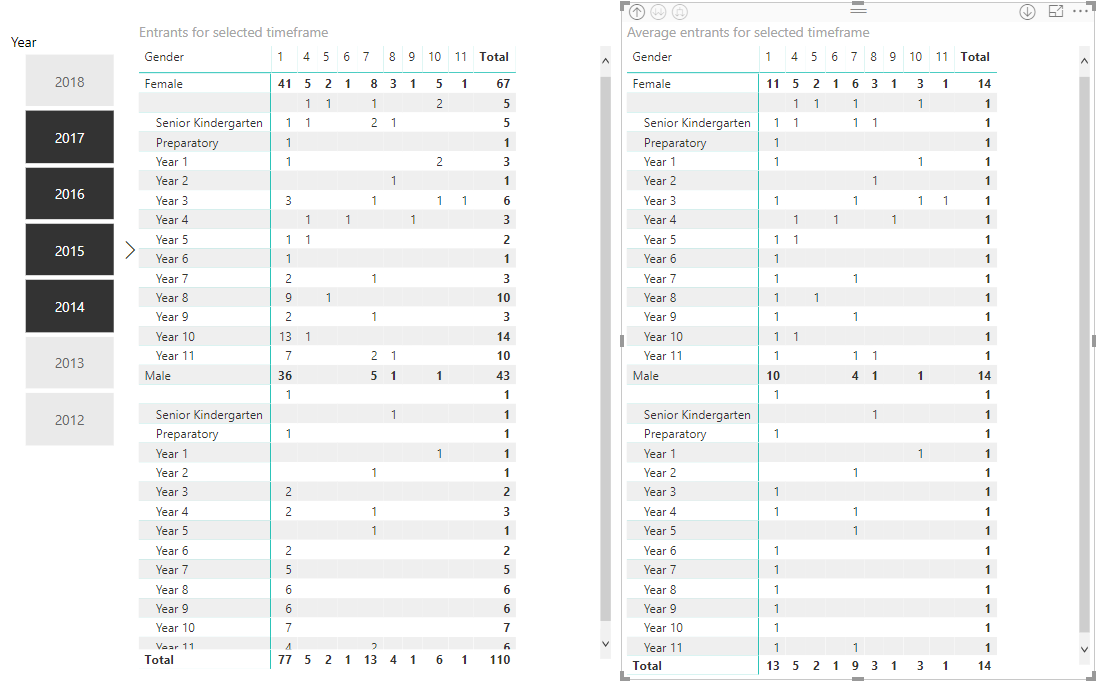
The left matrix is the raw summarised results over the time-frame selected, in this case the four years.
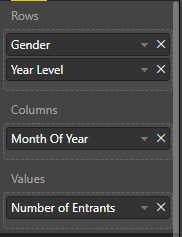
Number of Entrants is defined as
Number of Entrants = COUNT('Average Entrance Excel'[ID])
The right matrix is the averaged results over the same time-frame. The columns along the top are months of the year. The missing ones are where there is no data. This is correct.
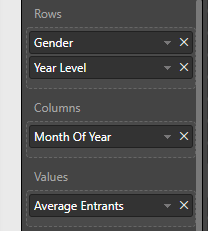
The DAX for that is:
Average Entrants =
   VAR MonthlyAverage = AVERAGEX('Average Entrance Excel', [Number of Entrants])
   VAR AverageTotal = SUMMARIZE( 'Average Entrance Excel', 'Average Entrance Excel'[Year Level], "Monthly Avg", MonthlyAverage)

   RETURN

   IF(
       HASONEVALUE('Average Entrance Excel'[Year Level]),
       MonthlyAverage,
       SUMX(AverageTotal, [Monthly Avg])
   )
My first challenge is that i need to create a cumulative to the end of year total of averages for each month. The normal cumulative pattern breaks down here.
That is, for say Senior Kinder, Jan = 1, Feb =1 , Mar = 1, Apr = 2, etc
Then, I need to somehow reference that cumulative total for that month back in my original function that we are working so hard on.
This is only the start. I will need to do something similar to this at least a dozen more times. Once I have the pattern I should be OK.
Thanks