Hi Forum - This has me stuck and your amazing help is hugely appreciated !!!
I have attached an example PBIX file. There is no date table included as the client works on a strange Week System and they do not require any other time intelligence by month etc.
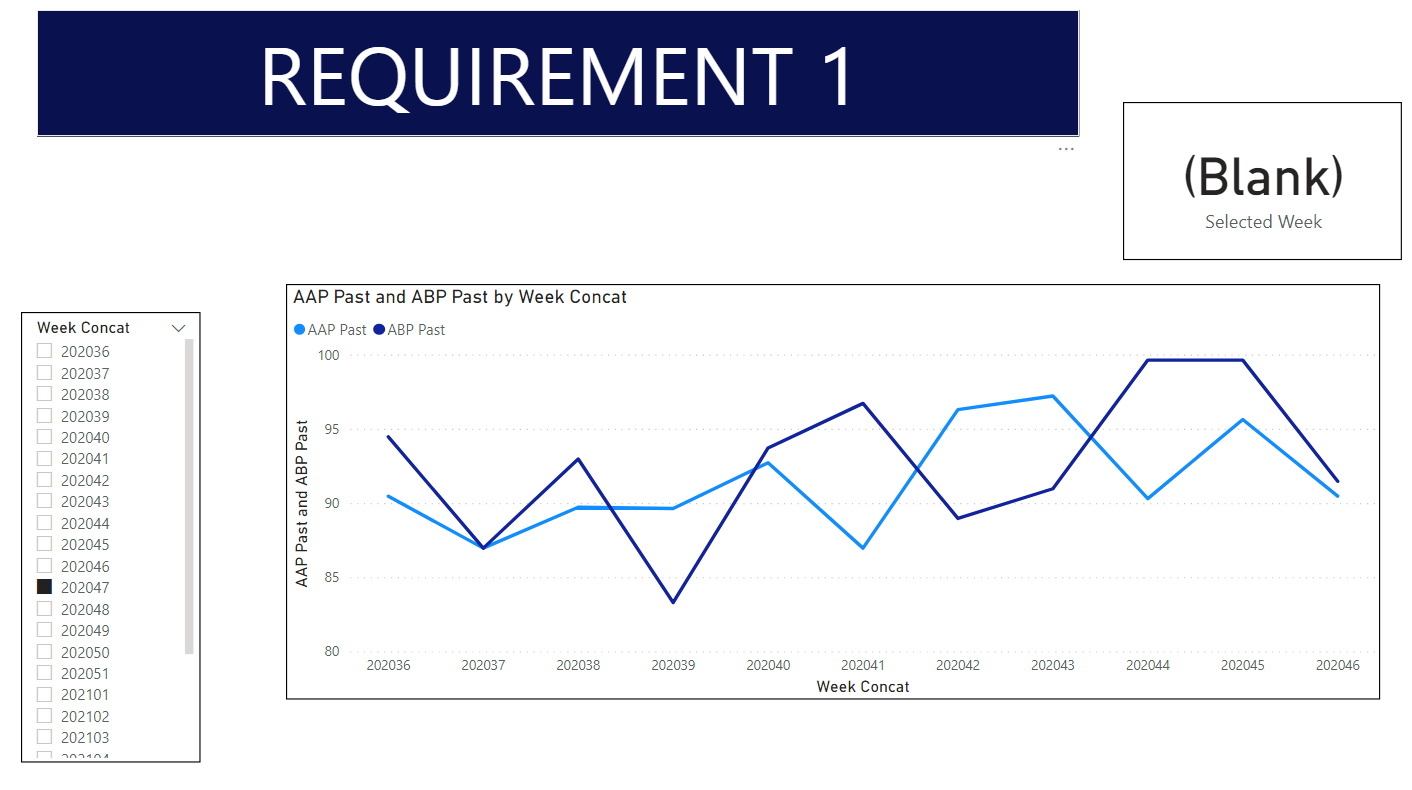
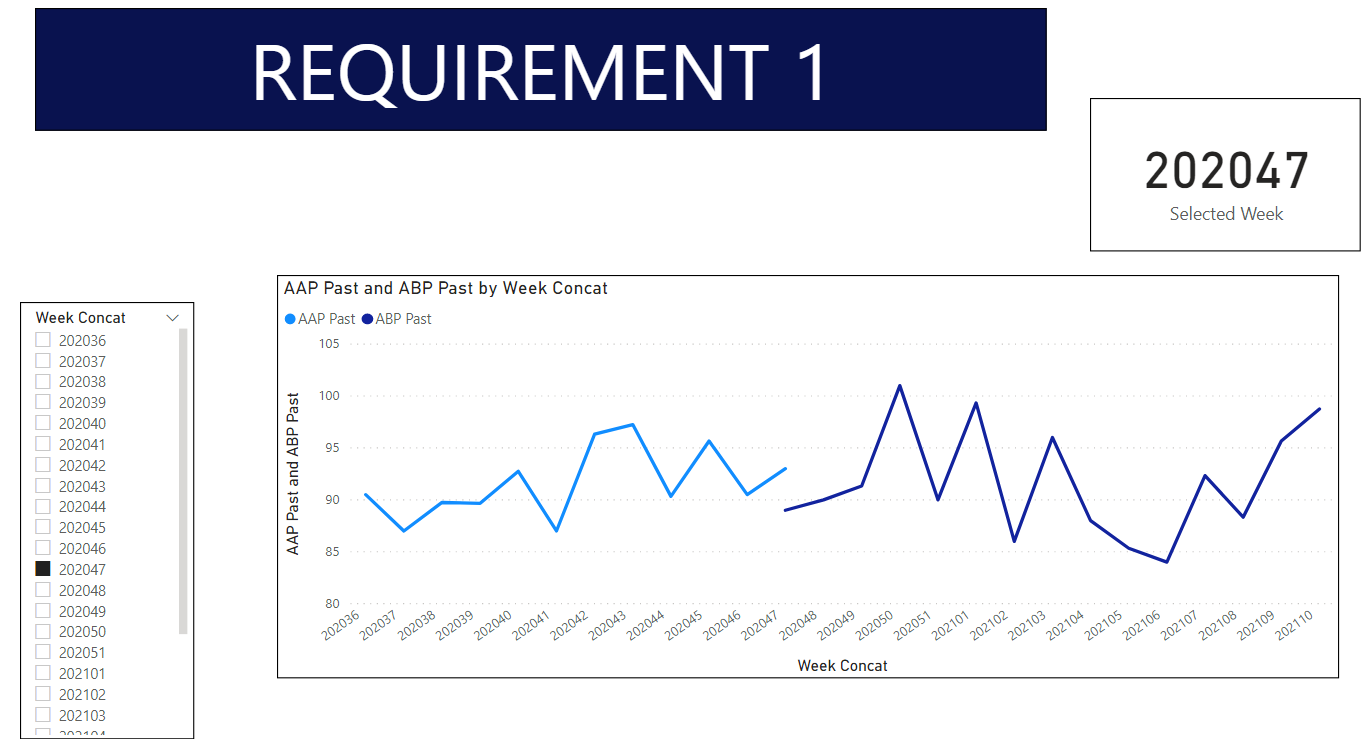
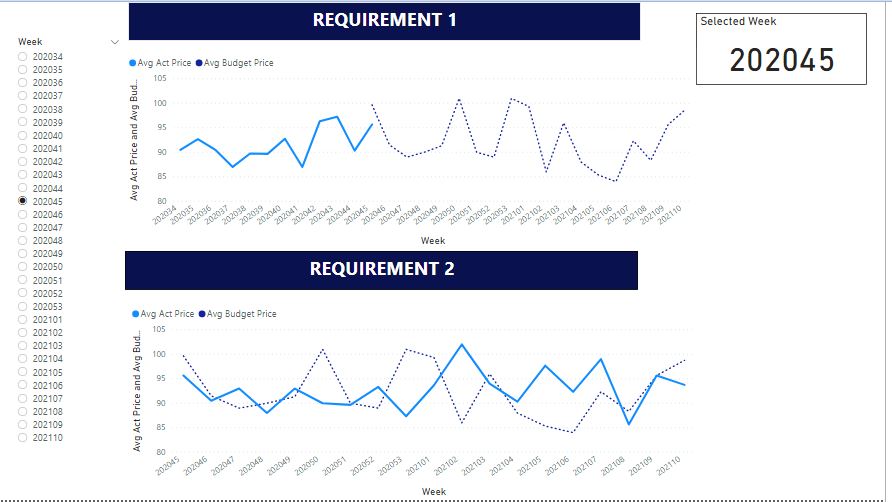
Requirement 1: (1st sheet in PBIX): Depending on which week is selected i wish to show:
a) A solid line showing the actual average price up to that week (and not beyond it)
b) A dotted line showing the budgeted average price after that week (and not before or including it)
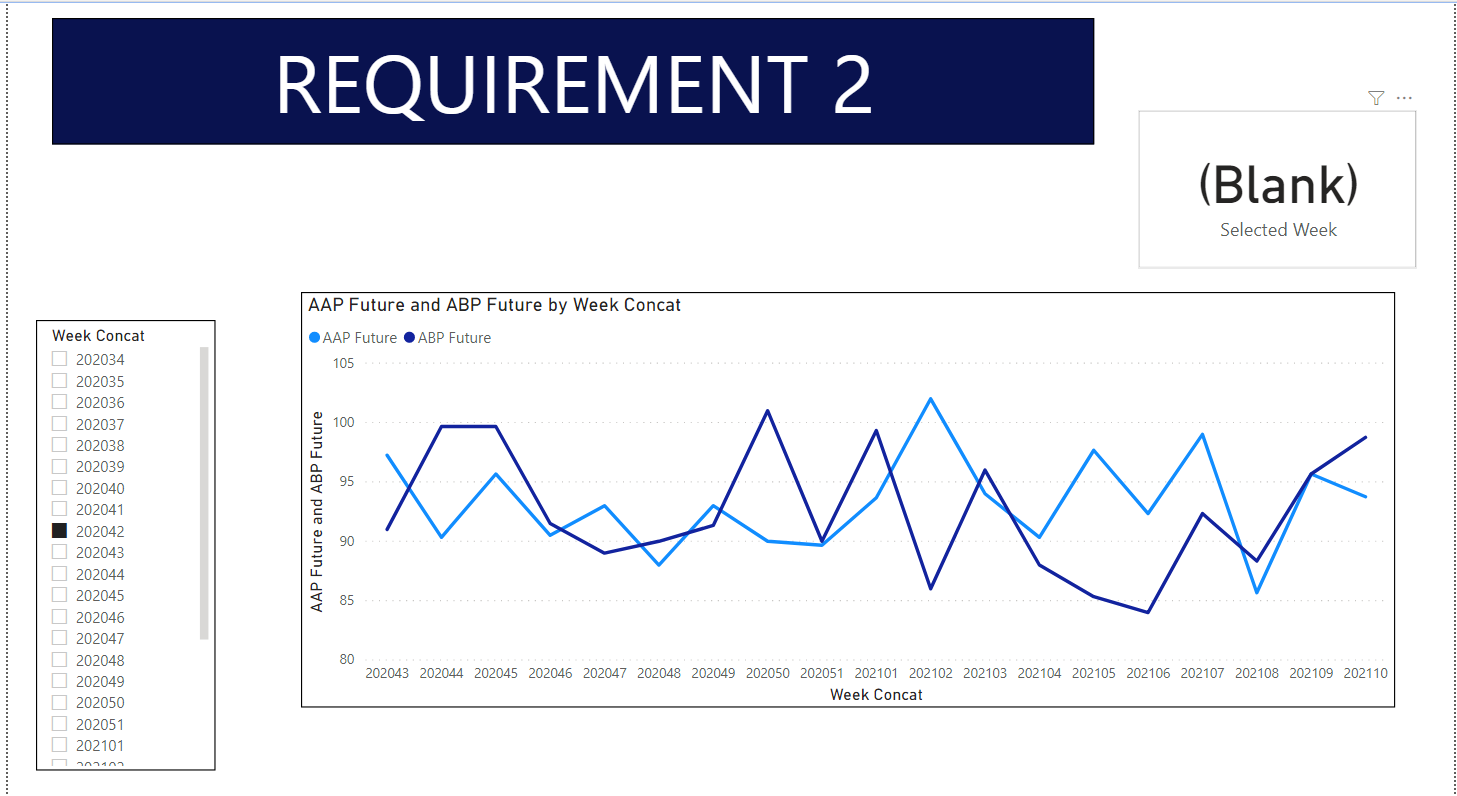
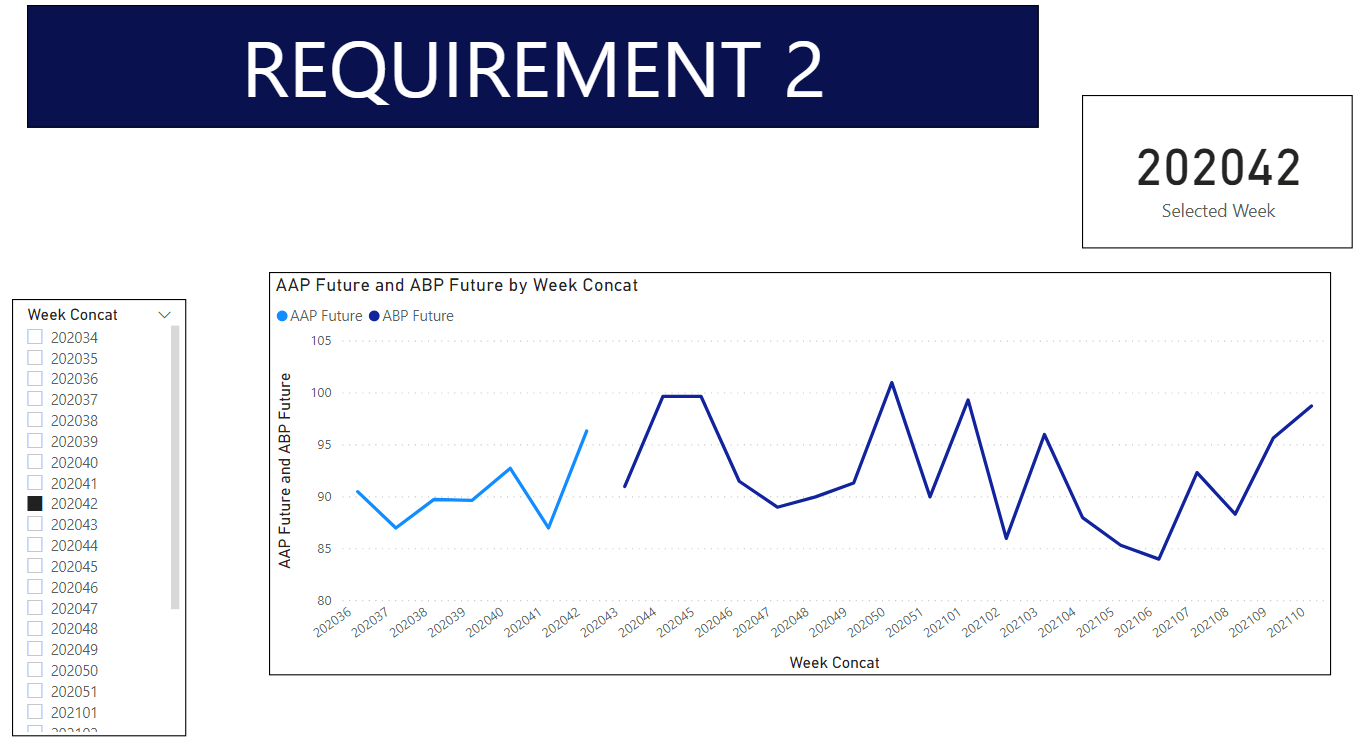
Requirement 2: (2nd sheet in PBIX): Which ever week is selected the graph will show that week and all the weeks after it (but not before it)
Thanks again guys and i really appreciate the help
Worked on this right before a call so can’t do much of write up at the moment but if you have any questions then feel free to ask. Let me know if this is what you wanted.
Based on your requirement you should have a separate table duplicate of your actual week table but you should not connect it source table as it will filter.
VAR TempWeek = CALCULATE( MAX ( DuplicateWeek[Week Concat] ), ALLSELECTED( DuplicateWeek) )
And then use this result to compare with the selected week under calculate.
Avg After Selected = CALCULATE ( [Average Actual Price], Weeks[Week Concat] > TempWeek)
Similar you can calculate the other one. Give a try and try to understand the logic.
The first graph should only be showing one line. Eg if week 50 was selected it would show the Actual Price line up to week 50 and after week 50 it would show the Budget price line. This would mean for each week there would only be one line. Sorry if i didn’t explain properly and thanks for your help.
Thanks a million. At first glance this looks great - I am going through in more detail now.
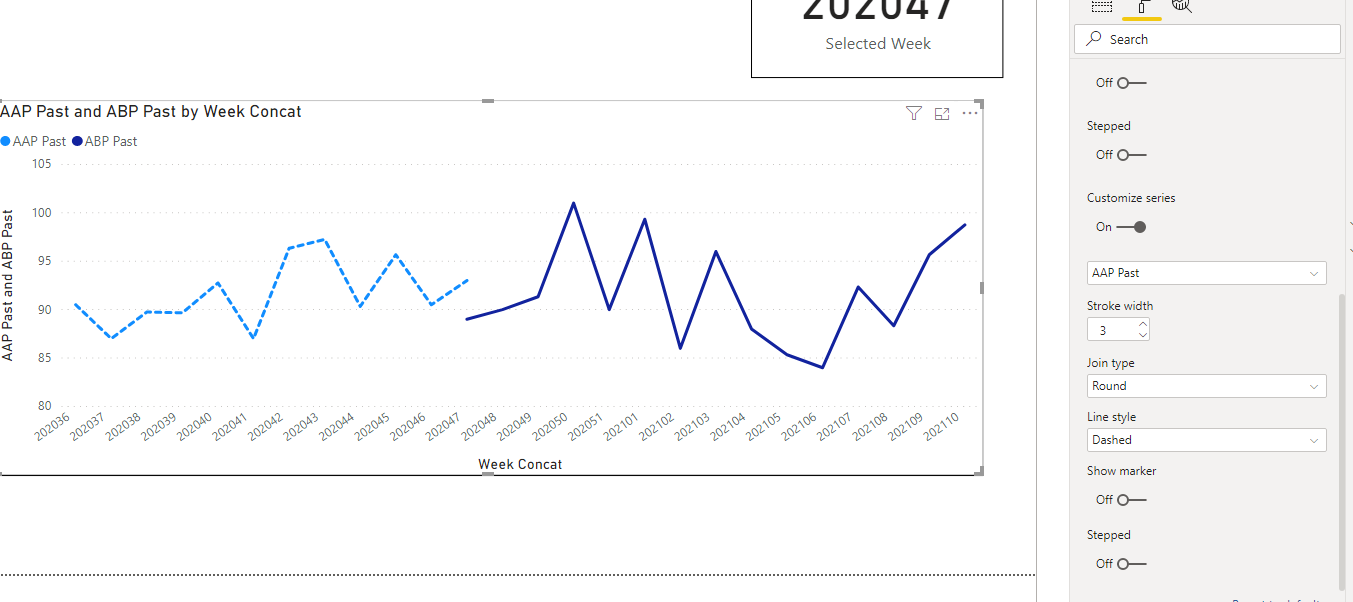
Out of curiosity, do you know if there is a way to make 1 line style solid and 1 line style dashed in the same graph. I can not see a way to only change one line style so maybe its not possible
I thought i got this but i have come into another problem per attached PBIX
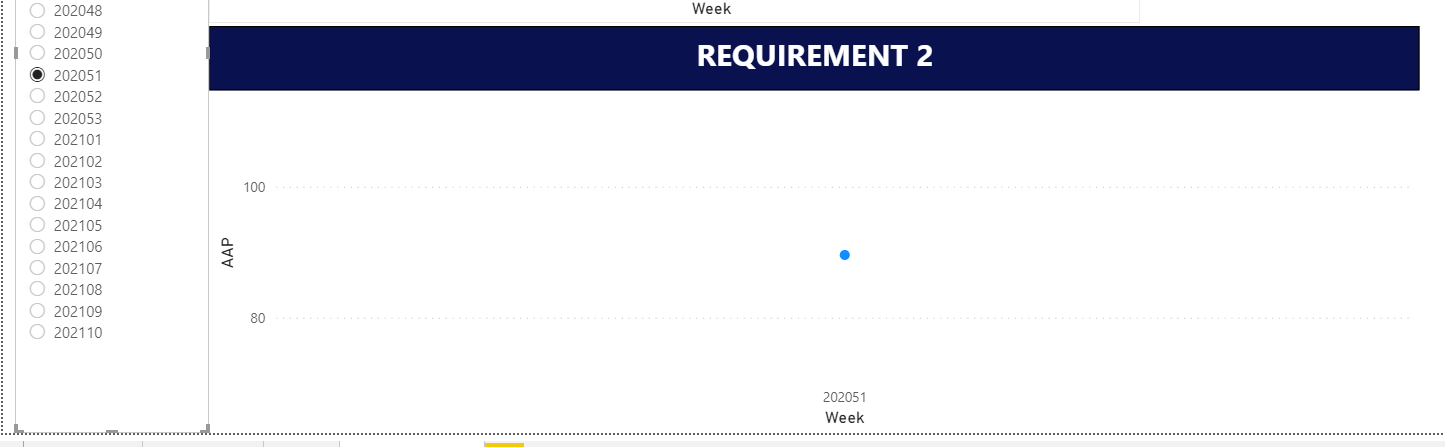
On Page 2 I would like to select a single date and the graph to then give me the last 4 weeks. I tried this with a “Top N” filter and it is not working - Any ideas?
Also I do not understand why in the graph AAP Future 2 and AAP Past 2 are giving different answers. Would you be able help and explain why this is please. As only one week is selected and thought they would give the same price
Here the logic for AAP Future 2 is >= Selected Week and AAP Past 2 is <= Selected Week
Definitely they will give different results… One for Future and another is for Past
but for the same week they should be they same shouldnt they? It is the average price by week. If the week is the same for each measure it should give the same answer?
If the measure contains > than it will provide the price for each week > than the one selected
If the measure contains < than it will provide the price for each week < than the one selected. As both measure include = (<= & >=) when a single week is selected they should give the same price - Agreed?
Thank You @Rajesh - That was well explained thanks.
If i wanted to use the slicer to average price and budgeted price for only the 4 weeks after the date selected what would be the best way? I tried using filters and selecting top n = 4 weeks but this did not work. It could be user error again though
Thanks again for help with this. I am going back through a few of the courses in the next couple of weeks
However, due to the year being part of a season, it does not work if you select 200101 as it does recognise the prev 4 weeks, Any easy workarounds? (In the graph, had amended the formula to include week selected and the next 4 weeks so per the graph it does next show the next 4 weeks when 2051 is selected)