Measure does not calculate value for all areas

Hi there,

I have got event data. I have a measure that calculates the sum of the min column and divides it by a certain number.: Measure looks as follows:

Measure =

Var cancel_date = Max(‘Table’[Cancelled Date (NZST)])

Var _type = MAX(‘Table’[EventType])

RETURN

IF(YEAR(cancel_date)>1900 && _type = 3,0,

CALCULATE (

SUMX ( ‘Table’,

([TotalConsumerMinutes])/91577

)))

I have shown the measure as follow:

However, it does not calculate the value for all areas. I exported the data into excel and quickly generate the desired result as shown in the following picture:
Screenshot 2021-03-11 102715

For example, area highlighted in red color has value in the desired result but output produced by the measure have 0 values for the same area.

I have attached the sample file. Could anyone help me where I made the mistake?
sample5.pbix (677.3 KB)

Hi @leo_89.

Your measure is calculating zero, so its your measure. I’d first add a proper [Dates] table, link it properly to the (I guess) [Cancelled Date (NZST), and copy-and-paste your bar chart into a table for development; add all of the columns used in the calculation of your measure, and hopefully the correct calculation will become apparent.

Hope this helps.
Greg

@Greg, In my actual file, I have a data table that has one to many relations with the fact table. Measure produces the same result.

Hi @leo_89. Sorry, I don’t understand: you have an additional [Data] table or do you have a [Dates] table? Are you saying that the PBIX you sent is not your work-in-progress? Perhaps you could provide a sample dataset in Excel, what the table would look like in Power BI, along with an Excel or screenshot mockup of your desired outcome? These would help the forum members visualize your issue.
Greg

Hi @Greg,

I have additional [Date] table in my actual file. There are quiet a few tables in my actual file. To avoid the complexity, I just used the main columns from fact table to re-create the issue I am having in my actual file. I have provided the date table in the sample file now and also included the desired output as screen shot.

Hi @leo_89

Your issue can be solved by using the Fix Incorrect Totals pattern. For more information, you can review this post:

Once a virtual table is added, the values sum as per your sample.


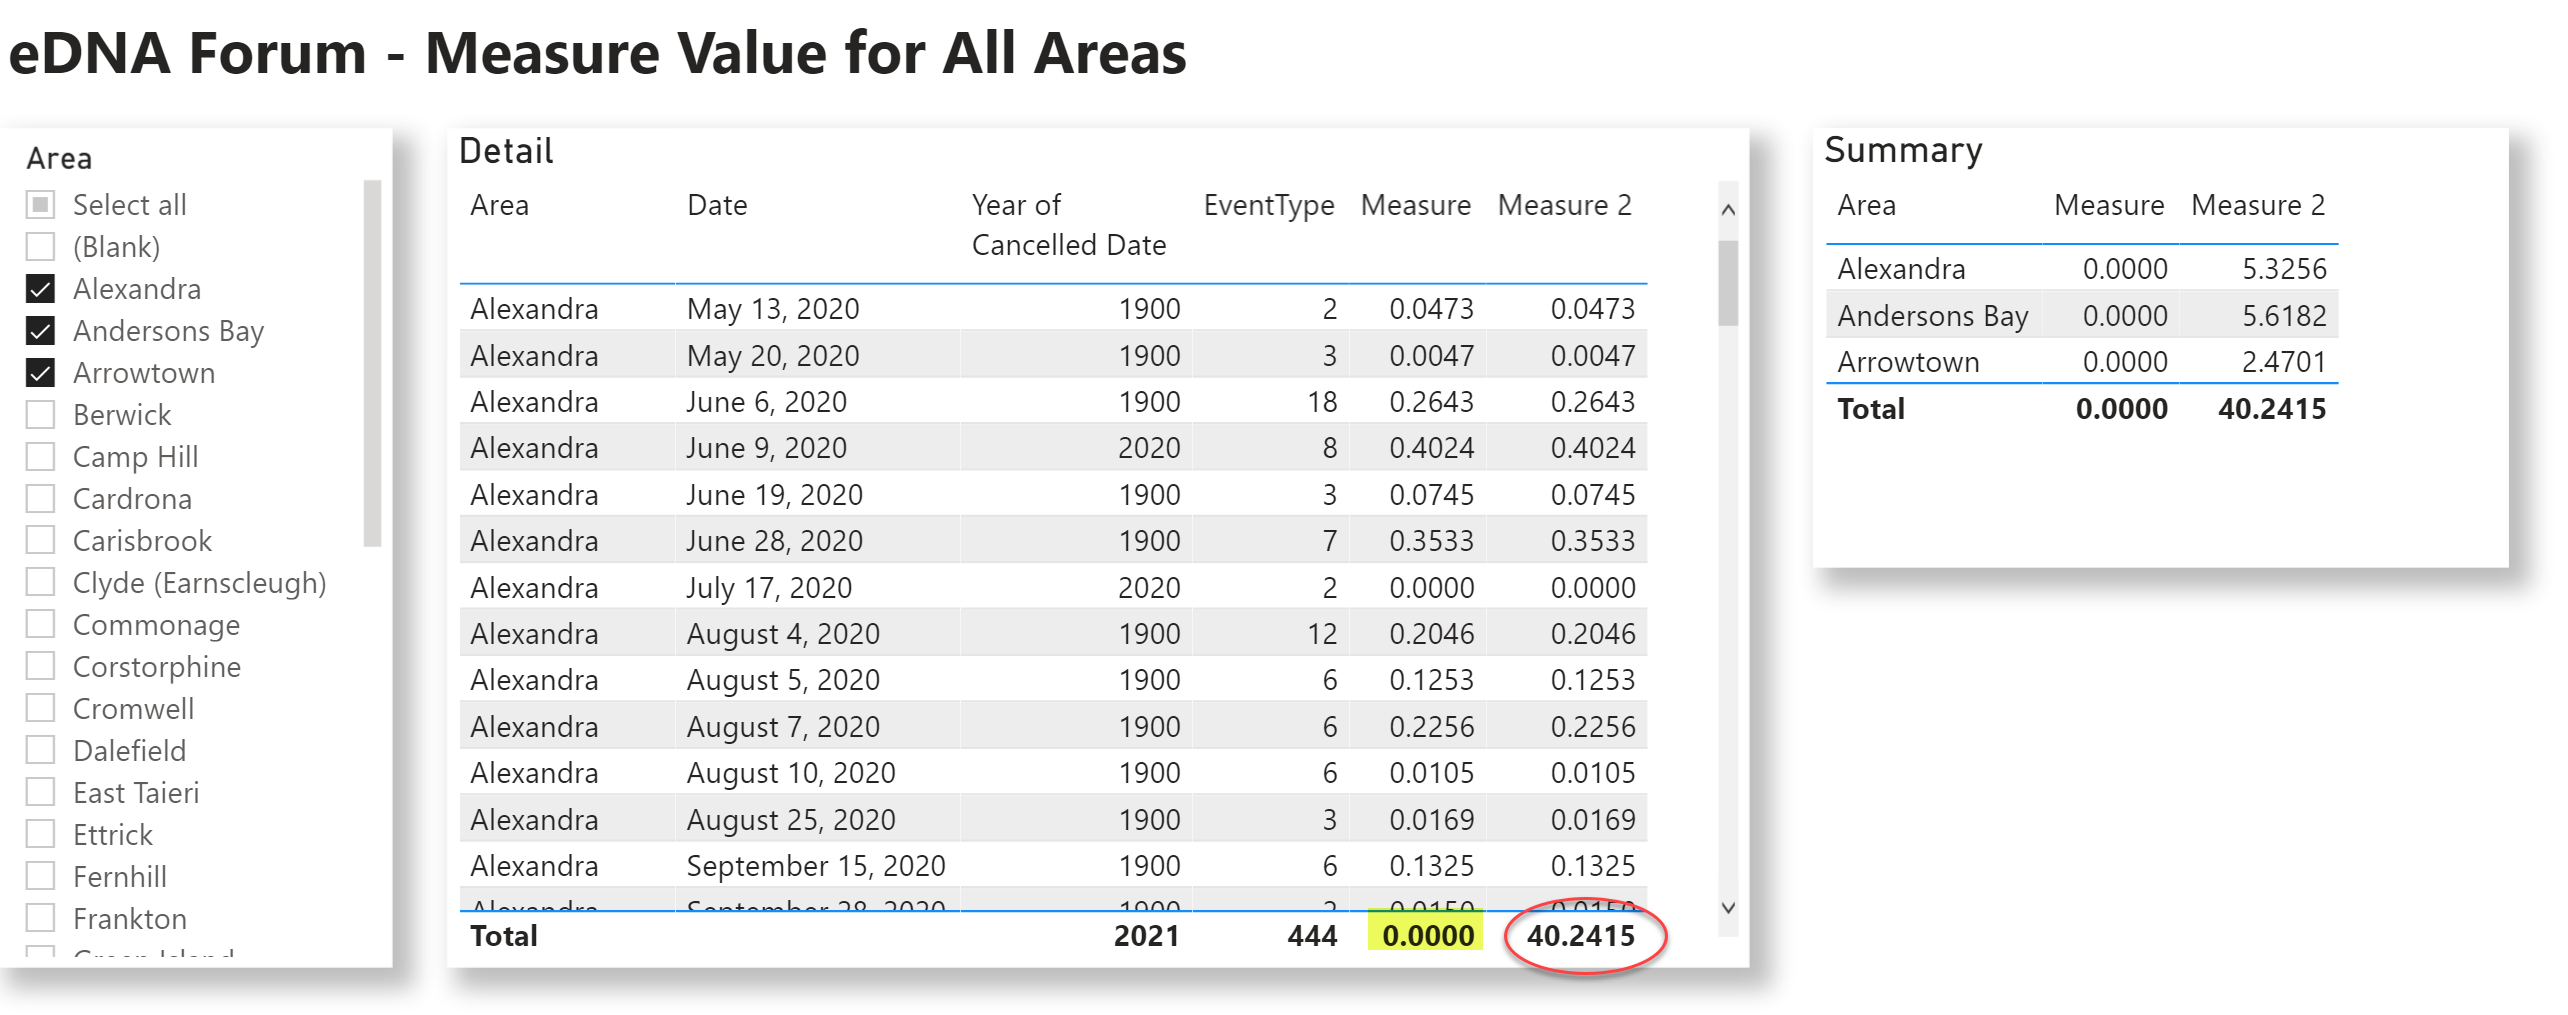
To see this in action, I created a “Detail” table that showed you measure accurately calculated the value per event, but when the event context is removed and you want the summarized value for each area, you need to add a virtual table. Here’s one measure that seems to match your expected values:

Measure 2 = 
VAR _YearOfCancelDate = YEAR( MAX( 'Table'[Cancelled Date (NZST)] ) ) 
VAR _EventType = MAX( 'Table'[EventType] ) 
VAR _vTable = ADDCOLUMNS(
    SUMMARIZE( 'Table','Table'[Area] ),
    "@ConsumerMinutes", SUM( 'Table'[TotalConsumerMinutes] )
) 
VAR _Result = 
-- IF( 
-- _YearOfCancelDate > 1900 && _EventType = 3 , 0 , 
CALCULATE( SUMX( _vTable , ( [@ConsumerMinutes] / 91577 ) ) )
-- )

RETURN
_Result

I’m not sure about the IF statement, so I left it commented-out. But this should give you the idea.

Hope it helps.
Greg
eDNA Forum - Measure Value for All Areas.pbix (680.0 KB)

1 Like