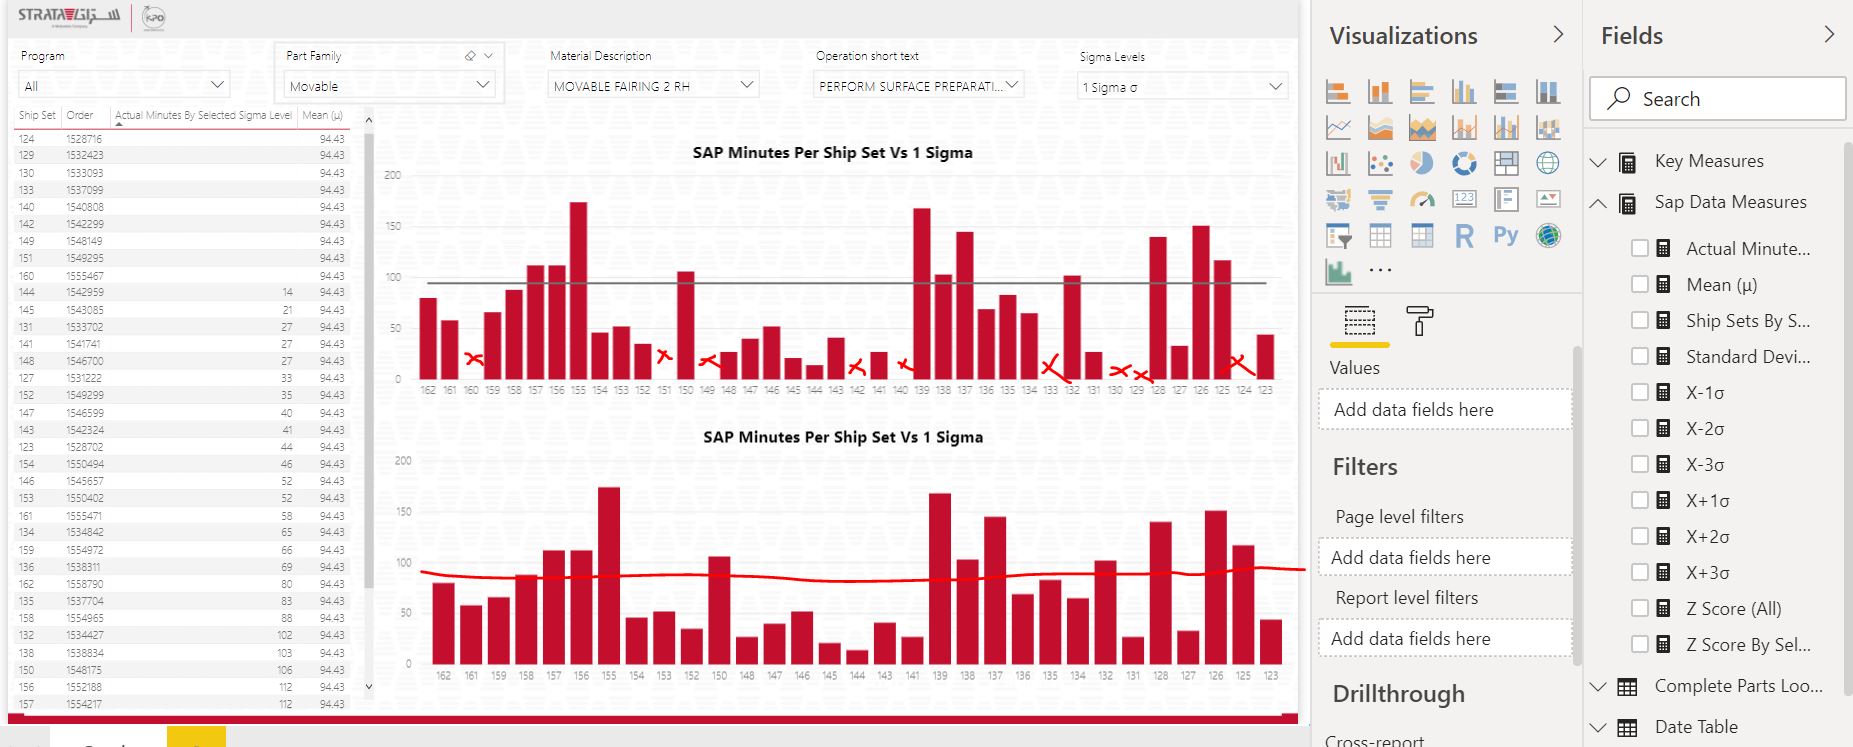
The reason for the blank columns appearing is that there’s no [Actual Minutes By Selected Sigma Level] value for each Ship Set on your axis BUT your Mean (μ) measure does have a value for each Ship Set… the measure below checks the [Actual Minutes By Selected Sigma Level] before returning the Mean (μ)
Mean (μ) no blanks =

    IF(
        ISBLANK( [Actual Minutes By Selected Sigma Level]) || [Actual Minutes By Selected Sigma Level] =0 |
        BLANK() |
        IF(BLANK()|BLANK()|AVERAGEX(ALLSELECTED('SAP Last 40 Ship Sets (Hassan)')|[Actual Minutes]))
    )
I have question what do the vertical lines mean ? as when i import them to my File i get errors i have had this before and cant remember how i solved it.