Hi all,
Please see report attached: Drill Through on Time Period.pbix (116.5 KB)
I want to create a Matrix which will summarise the number of Enquiries, by Method of Contact, by different time periods:
- Current Week
- Last Week
- Current Month
- All Time
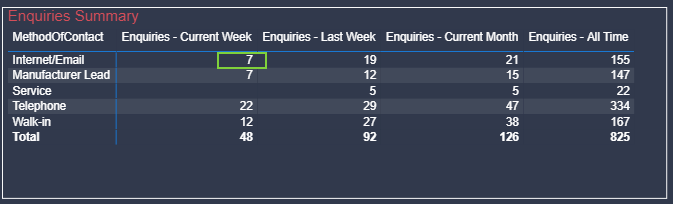
I can create measures for ‘Current Week’ , ‘Last Week’ etc, however when you Drill Through to a detail report, filters contained within the measures are not passed through to the drill down report.
So for example if I drill down on the 7 enquiries highlighted above for Internet/Email, the detail report will contain 155 records and not 7.
This problem can be demonstrated on tabs Summary 1 and Detail 2 in my report.
For the Drillthrough to work, I need to add a Dimension of Time Period to the columns attribute of my matrix. However as a single record in my Enquiries Fact table can be attributed to multiple time periods (eg Current Week and Current Month), I can’t simply add a Time Period column to my Fact table.
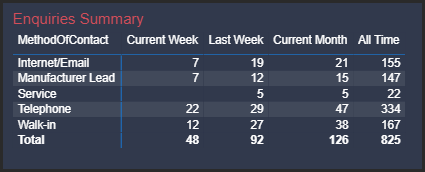
I have come up with one solution which is to create a second fact table [EnquiriesByPeriod], which is made up of appended subsets of my original Enquiries fact table, each containing rows for the desired time period and adding a new column ‘Time Period’ to identify each:

This now allows me to create my Matrix, using the new ‘Time Period’ column and utilising one measure for the count:
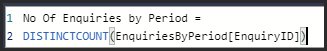
Now my Drill Through works as expected and I get 7 rows in my Detail report. 
See tabs Summary 2 and Detail 2 in my report.
However, I am aware that there are some draw backs of this.
- I am creating a 2nd fact table which will contain many more records than the original.
- I cannot relate my Date table to the second fact table as it complains of a circular dependency
- As the users will want to see many more columns in their detail report, each Summarize statement in my derived fact table will need to contain many more fields.
So that is my attempt at fixing the problem and I would be interested to receive other peoples views on the solution or if in fact there is a better and more simply work around to the Drill Through problem!
Thanks
Mark