I am working on an HR measure where we are trying to see how often leaders (positions) are changing in our organization.
I have for each position, the employee who held the position, and the assignment start and end date.
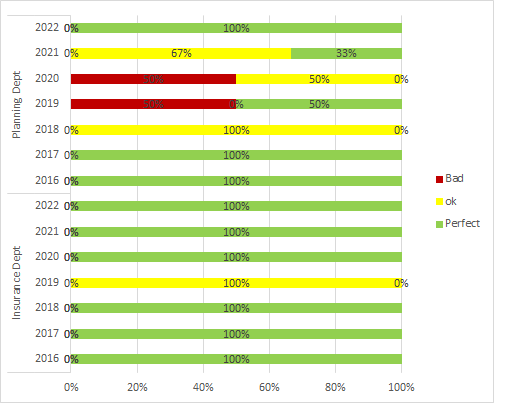
What I am trying to achieve is to count how many employees held a position in a year and assign a status (2 or less: perfect, 3: ok, more than 3: bad) and then calculate the % per department per year of how many positions are in each status. like this:
I can get the count to work by year by following the method described in this post. Then to assign a status for the count, I created a sub-table from my main one, but the date or year filter don’t work on that table since the relationship is in-active.
I feel this problem has already been solved on this forum but in different context, I am just not sure what to search for. Any help or redirection is really appreciated.
OK, lots of issues to address here. Before jumping in to DAX, the first steps are to make sure your data prep and data modeling are done correctly. To square those up, here are some of the issues that need to be addressed:
Your date table needs to be marked as a date table for time intelligence calculations like the ones you are doing to work properly. (And your date table, while not wrong is extremely limited, which will limit the analyses you can do).
If you are going to calculate Position Holders Count and Status as calculated columns rather than measures, they should reside in the Assignments table, rather than a separate DAX calculated table. (and always try to avoid the use of bi-directional relationships, which can lead to ambiguity and unpredictable DAX results)
the Assignments table should be broken up into fact and dimension tables, linked by one-to-many unidirectional relationships
Once that’s completed, I would suggest rewriting the DAX for Status as a SWITCH(TRUE) statement, rather than a series of nested IF statements - much easier to follow and debug.
If you haven’t already, I would strongly recommend going through the Power BI Super Users Workshop, which addresses each of the above issues. It’s likely that doing that and squaring up the issues above will lead you to the outcome you’re looking for, but if not just give a shout.
Hi @Omneah, did the response provided by @BrianJ help you solve your query? If not, how far did you get and what kind of help you need further? If yes, kindly mark as solution the answer that solved your query. Thanks!
Thank you for the reply. I was able to complete the steps you mentioned. Switch(True) is so much easier than nested ifs! wish I knew it earlier. Only thing I wasn’t able to do is add Position holders count as a calculated column in the assignments table. When I do, it doesn’t recognize the date table and its inactive relationships and I’m back to square 1.
In the new table where I separated the positions details I can add these two calculated columns and they work to show me the results I want but only for one year
This year count = CALCULATE(DISTINCTCOUNT(Assignments[emp id]),
filter(values(Assignments[Assignment Start Date]),year(Assignments[Assignment Start Date])<=Year(today())),
filter(values(Assignments[Assignment End Date]),year(Assignments[Assignment End Date])>=(year(today()))))
this year status =
var countholders=Positions[This year count]
return
switch(true(),
countholders<1,"",
countholders<3,“perfect”,
countholders=3,“ok”,
“Bad”)
But now I cant compare the performance of multiple years like in the chart in the original post.
My guess is I have to:
change the context in this calculation so it calculates for each position and not aggregate for the department (something along the line of allselected(), or allexcept() maybe)
Position Holders Count =
CALCULATE(DISTINCTCOUNT(Assignments[Badge]),filter(values(Assignments[Assignment Start Date]),Assignments[Assignment Start Date]<=Max(‘DateTable’[Date])),filter(values(Assignments[Assignment End Date]),Assignments[Assignment End Date]>=MIN(‘DateTable’[Date])))
then create a separate ref table for the status with row for each with upper and lower limit instead of the switch function so I can use the status as a chart legend without the calculated column.
Great - glad that was helpful. So that I can continue working through the remaining issues with you, please provide a copy of your PBIX work in progress.
If you have any sensitive data in the file, here are a number of different options for creating a version that you can post publicly in the forum.
Thank you for your help on this. I was able to solve the problem by creating a % measure for each of the status like this:
divide(SUMX(DISTINCT(Assignments[Position #]),if([Position Holders Count]>3,1,0)),[Position Count],0)