Hi,
I am having issues visualising my reports as figures are not adding up even if it seems though the DAX measures are right.
The measures are:
First Order Date = MIN ( Orders[Order Date] ) – this to get the first order day
Next Order Date =
VAR _FirstVisit = MIN (Orders[Order Date] )
VAR Result = CALCULATE ( MIN ( Orders[Order Date] ), Orders[Order Date] > _FirstVisit )
RETURN
Result – to get the day the same customer made an order
Re-Orders Within 5 Days =
VAR _Orders = VALUES( Orders[Customer ID] )
VAR _Table =
ADDCOLUMNS( _Orders,
“@Day_Diff”, IF( [Variance Between First and Next Orders] >= 1 && [Variance Between First and Next Orders] <= 5, 1, 0 )
)
VAR Result = SUMX( _Table, [@Day_Diff] )
RETURN
Result — this counts a process where customer re-orders within the specified conditions
I tried to test with:
Re-Orders Within 5 Days Test =
CALCULATE (
COUNTROWS ( Orders ),
FILTER (
Orders,
Orders[Customer Re-Orders within Days] >= 1
&& Orders[Customer Re-Orders within Days] <= 5
)
)
And I have a calculated column with this DAX code:
Customer Re-Orders within Days =
VAR temp =
TOPN (
1,
FILTER (
Orders,
Orders[Customer ID] = EARLIER ( Orders[Customer ID] )
&& Orders[Order Date] < EARLIER ( Orders[Order Date] )
),
Orders[Order Date], DESC
)
RETURN
DATEDIFF ( MINX ( temp,Orders[Order Date] ), Orders[Order Date], DAY )
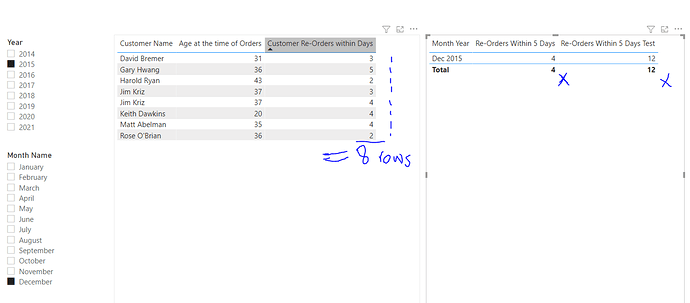
My requirement is to count a condition where a customer re-order within 1 to 5 day and plot this against the month-year but as seen in the below image this is not working for me.
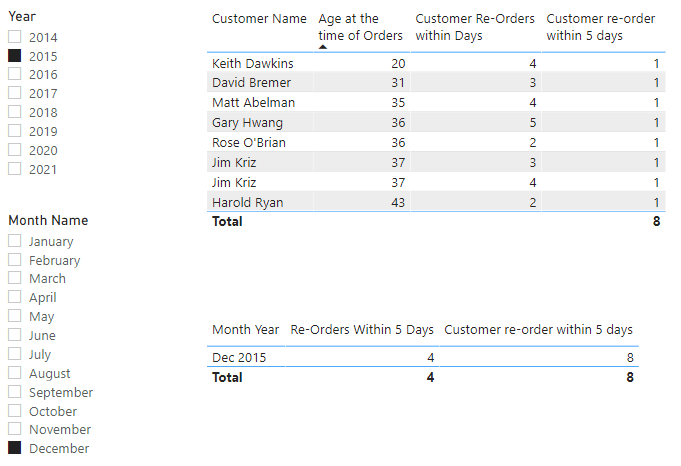
A count of Customer Re-Orders Within Days 8 but when plotted against Month-Year, it produces a wrong result.
My sample file is attached.
Super Store Model.pbix (959.4 KB)
Thank you in advance. I honestly do appreciate your help

