I need help.
I don’t know what I am doing wrong. My model looks nice and simple but my measures which should be simple enough is not right.
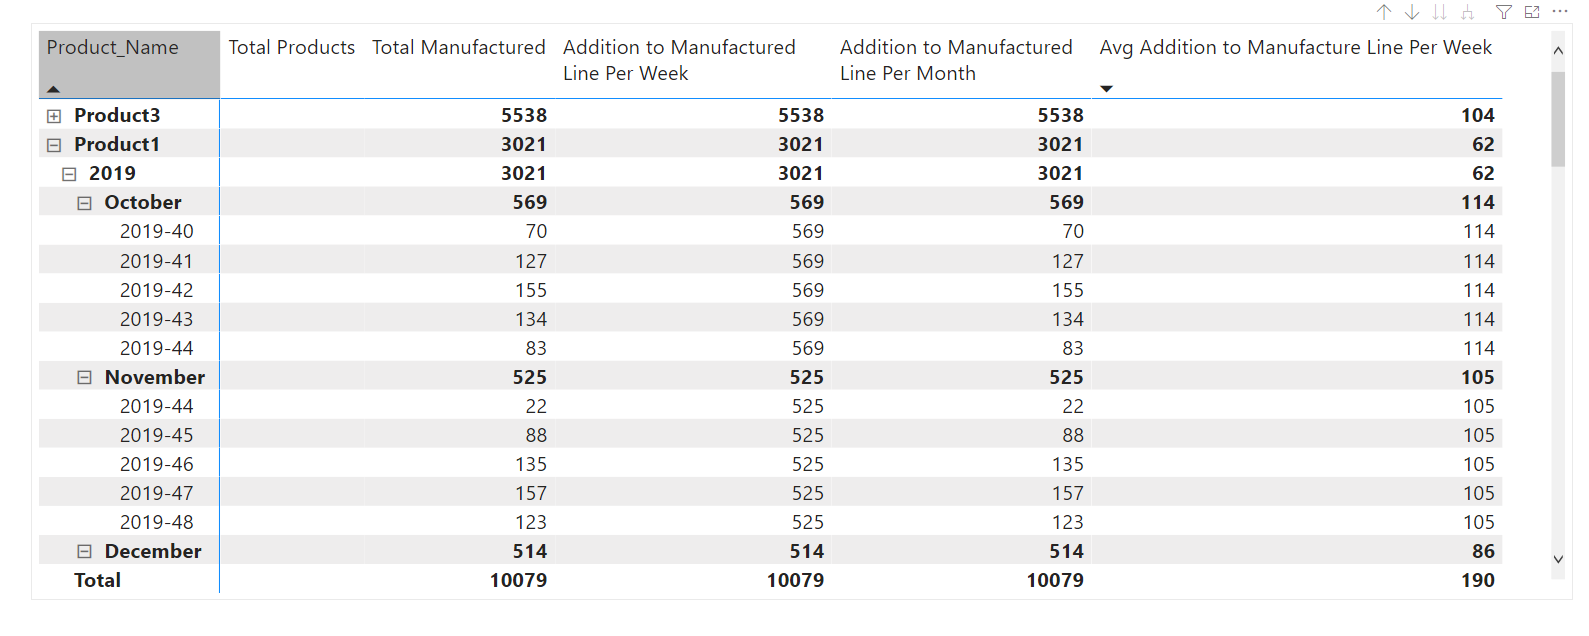
I have computed simple measures like:
I agree with @Anurag that seeing the mockup of the desired results will be very helpful in crafting a solution.
Your data model looks completely solid. The problem is in your measures – what you’ve actually done is rewritten the same measure three different ways, since the VALUES function will respect the filter context in the visual, while ALL will not. To demonstrate this, in your measures try replacing VALUES with ALL – they will generate the same virtual table, but behave very differently with regard to the filter context in the visual, and thus will return very different results.
If this is not clear to you, I would suggest watching the recording of Power BI Accelerator Week #3, where @sam.mckay and I go through these filter context concepts in detail.
Just so we’re not playing a back and forth guessing game, can you please mock up the results you are expecting in each column in Excel? Then we can be sure that the solution @Anurag or I provide will meet your requirements.
Hi @upwardD just following up if did the response provided above help you solve your query?
If not, how far did you get and what kind of help you need further? If yes, kindly mark as solution the answer that solved your query.
I hope that you are having a great experience using the Support Forum so far. Kindly take time to answer the Enterprise DNA Forum User Experience Survey, we hope you’ll give your insights on how we can further improve the Support forum. Thanks!
Hi @upwardD, we’ve noticed that no response has been received from you since Sep 15. We just want to check if you still need further help with this post? In case there won’t be any activity on it in the next few days, we’ll be tagging this post as Solved.
Hi @upwardD, due to inactivity, a response on this post has been tagged as “Solution”. If you have a follow question or concern related to this topic, please create a new thread.