Dear Enterprise DNA forum,
I would like to ask your help to find a solution to this little problem. I am working with a very basic dataset about the top 10 tennis players ranking over a number of years. Just 3 columns: Year, Player, Ranking (1 to 10). Some players appear for many years, often with different ranking, some just once.
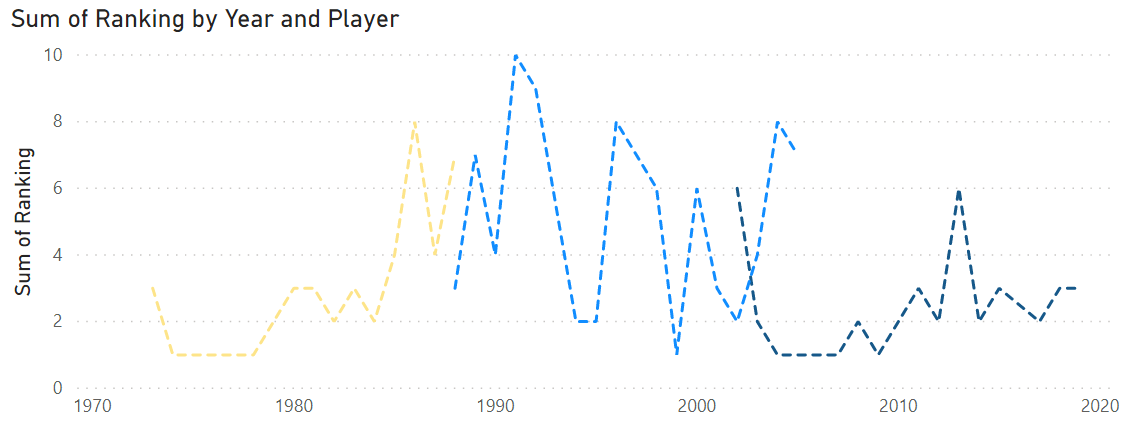
In my exercise, I am preparing a line chart visualization to show how their presence in the Top 10 evolved over the time they have been in (Year on the X and Ranking on the Y). What I would like to achieve is having the Y axis inversely sorted so that rank 1 shows the peak and rank 10 the lowest point. Is there a solution for this? Was considering working with negative numbers that would reverse the view, but was wondering if there’s a smarter solution.
Thanks a lot in advance, really appreciate your support
Ciao
Hi @Anferrig,
I don’t think there is a native setting for the visual which allows you to invert the axis currently.
The suggested workaround would be to multiply your values field by -1 and this should work. So in your case multiply your Sum of Ranking by -1 you could create a calculated column or do it as a measure.
Hope this helps.
H
Thanks for posting your question @Anferrig. To receive a resolution in a timely manner please make sure that you provide all the necessary details on this thread.
Here is a potential list of additional information to include in this thread; demo pbix file, images of the entire scenario you are dealing with, screenshot of the data model, details of how you want to visualize a result, and any other supporting links and details.
Including all of the above will likely enable a quick solution to your question.
A response on this post has been tagged as “Solution”. If you have a follow question or concern related to this topic, please remove the Solution tag first by clicking the three dots beside Reply and then untick the check box. Thanks!