Hi,
As a new power bi user im looking for some clarification on best practice approach on how to process the introduction of a new table im working with. The new table is summarised at a higher level than the new measures table im looking to introduce. so i cant see how a straight relationship will work.
The data sources
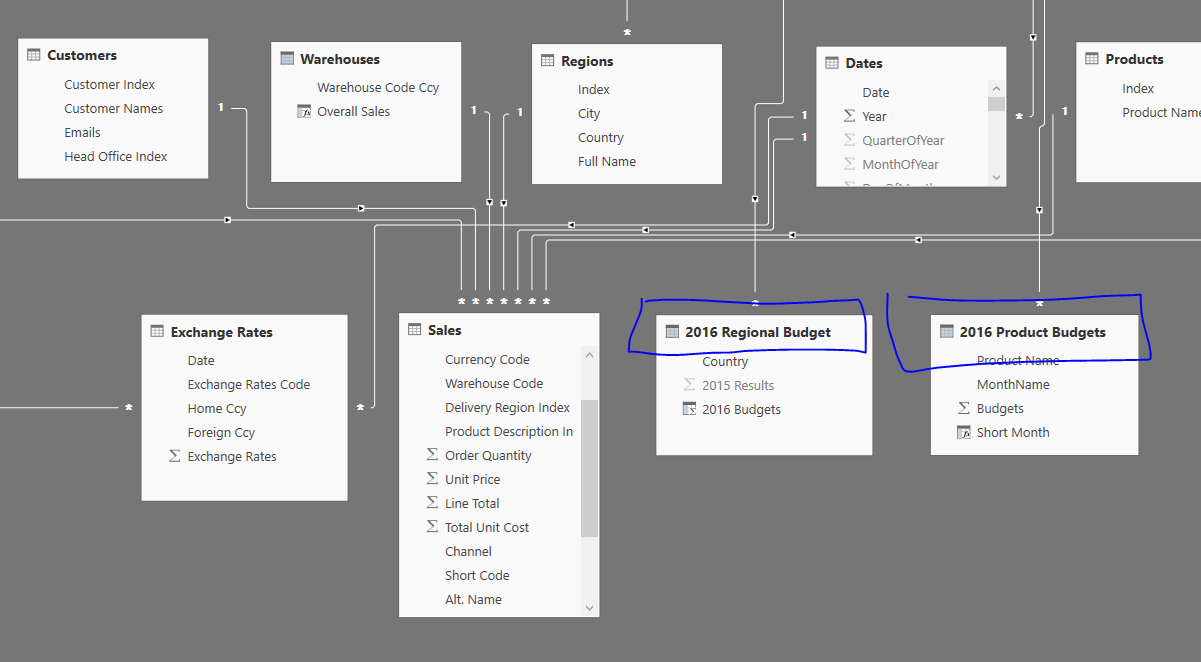
I already have an existing table which has a month, country and each country has a further 29 subcategories, plus a measures column.
the challenge is that i have a new table with month and country only (no subcategories) and its associated measure.
So im looking for advice on the best approach to introduce the new two-tier table to the three-tier table.
Hi Sam,
ok so im making good progress with your courses, really helping me get my head around data models etc.
i have a related but slightly different question now.
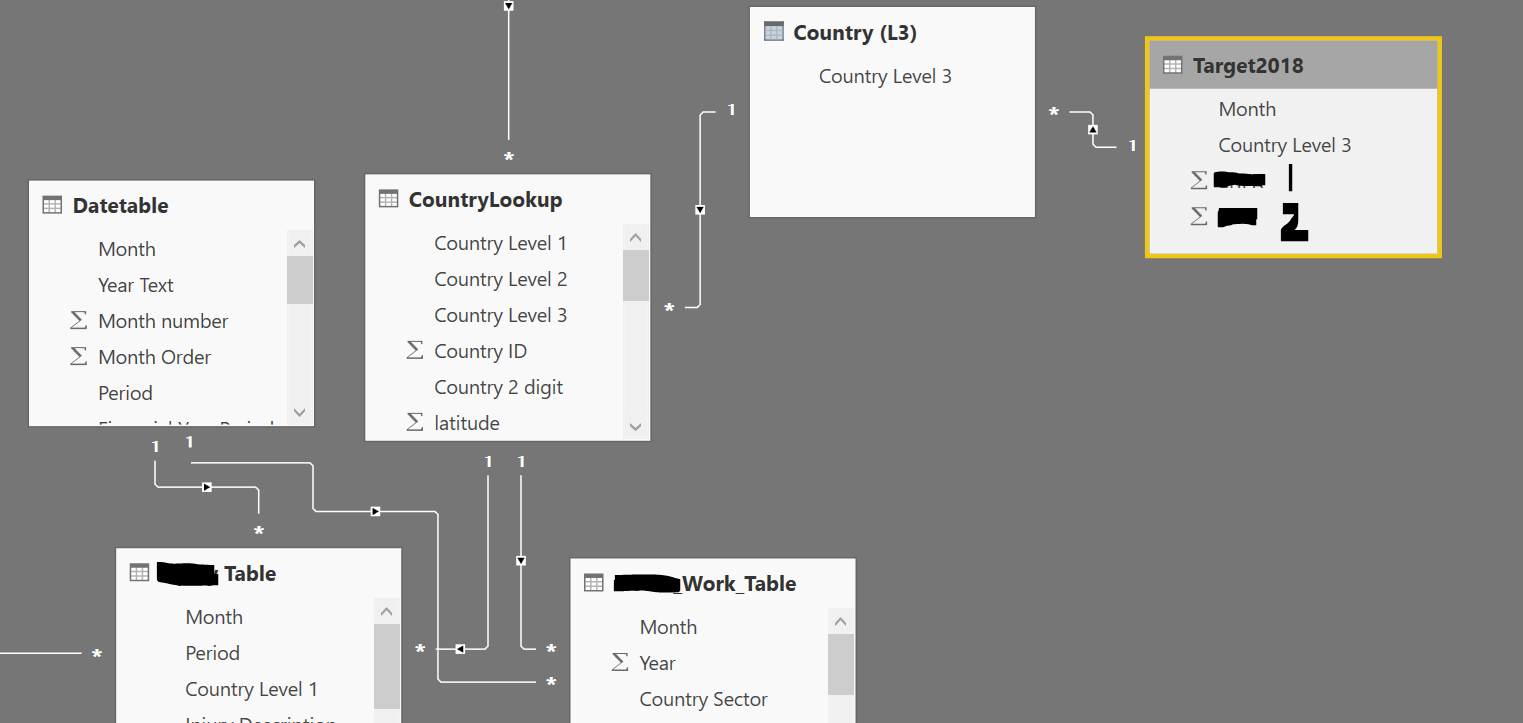
i have the following tables;
target table - this is an annual target based on an expected country (level 3 mean meaning highest country grouping) rate figure (its not a sum figure, so i cant break out in the way you mention in your videos)
two supporting tables - monthly data
As you can see i created a country level 3 table to give me a distinct row of countries, as you advise.
my issue is i cant work out how to show the unique target figure for each country along side the associated data from the two other monthly based tables without it summing up all the months
Cheers
peter
Hi Sam,
I had actually watched these all already. But as always i missed one small part which was important to get the model working.
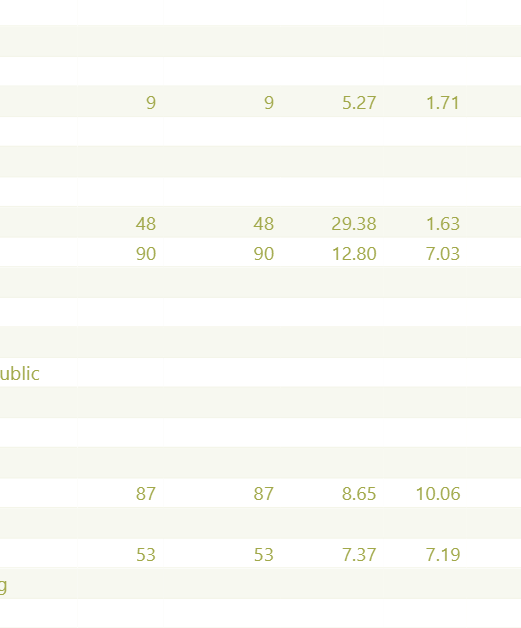
so now i need to remove the blank rows, i know ive seen you mention it somewhere (DAX command at the end to hide rows) but cant find it.
cheers
peter