Integrated Financial Reporting - Revenue and Expenditures

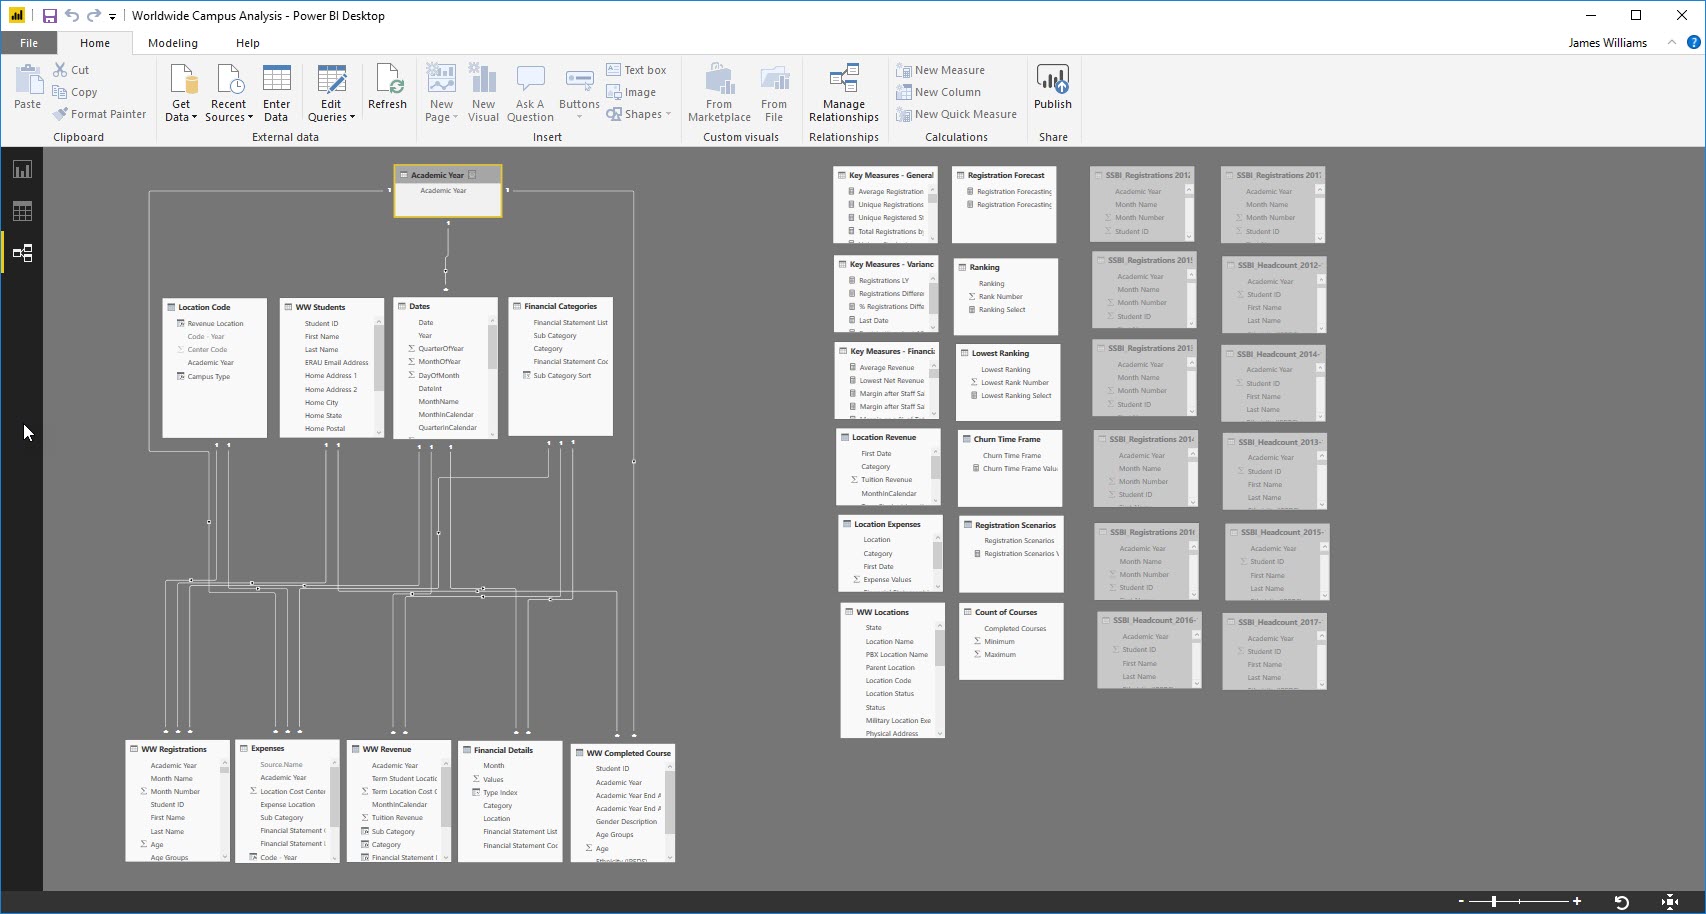
So Leveraging the video on Integrated Financial Reporting and the one on PnL Statements I came close to what I wanted to show which was revenue and expenditures in the same table. Because my revenue and expenditures did not come in the same file/table I had to do some creative stuff. The Revenue is born out of the Registrations data table which is the sum of tuition paid by student per class in the academic year.

When using the below for financial results the only thing that shows up in the data table is the Revenue this is why I am thinking that something is wrong with it even though the table that its drawing from called ‘Financial Details’ was successfully created reflecting revenue and expenditures for locations.

Financial Results = SUM('Financial Details'[Values])

To extract Revenue from my Registrations table I used the following:

WW Revenue = 
SUMMARIZE('WW Registrations', 'WW Registrations'[Academic Year], 'WW Registrations'[Term Student Location], 'WW Registrations'[Term Location Cost Center], Dates[MonthInCalendar], "Tuition Revenue", SUM('WW Registrations'[Class Price]))

Then created ‘Location Revenue’ using the following:

Location Revenue = 
SUMMARIZE('WW Revenue', 'WW Revenue'[Term Student Location], 'WW Revenue'[Financial Statement List], 'WW Revenue'[Financial Statement Code], Dates[MonthInCalendar],
    "Category", "Revenue",
    "First Date", MIN(Dates[Date] ),
    "Tuition Revenue", [Revenue Total] )

From my Expenses data table which I do not have to extract from some other table I created ‘Location Expenses’ using the following:

Location Expenses = 
SUMMARIZE('Expenses', Expenses[Expense Location], Expenses[Financial Statement List], Expenses[Financial Statement Code],
    "Category", "Expenses",
    "First Date", MIN(Dates[Date] ),
    "Expense Values", [Overall Expenses] )

The ‘Financial Details’ table is created from the following:

Financial Details = 
UNION( 'Location Expenses',
    SUMMARIZE('WW Revenue', 'WW Revenue'[Term Student Location], 'WW Revenue'[Category], 'WW Revenue'[MonthInCalendar], 'WW Revenue'[Tuition Revenue], 'WW Revenue'[Financial Statement List], 'WW Revenue'[Financial Statement Code]))

My desired outcome is to be able to show Revenue and Expenditures like presented in the videos but specific my scenario which would be based on the actual Campus Location followed by Revenue and Expenditures and their subcategories by academic year.

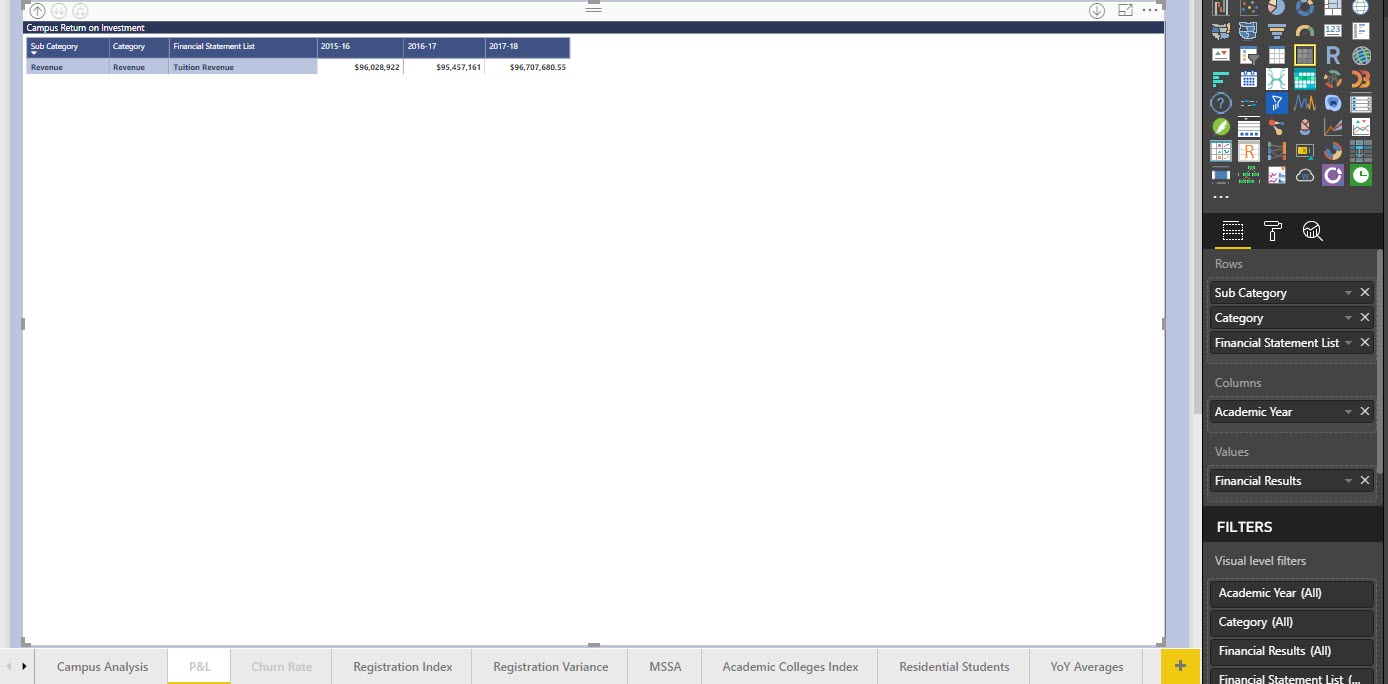
With the [Financial Results] measure below is the output which is the correct values for the Revenue but Expenditures don’t show even though they are int he same column in the table that the measure draws from.

Financial Results = SUM('Financial Details'[Values])

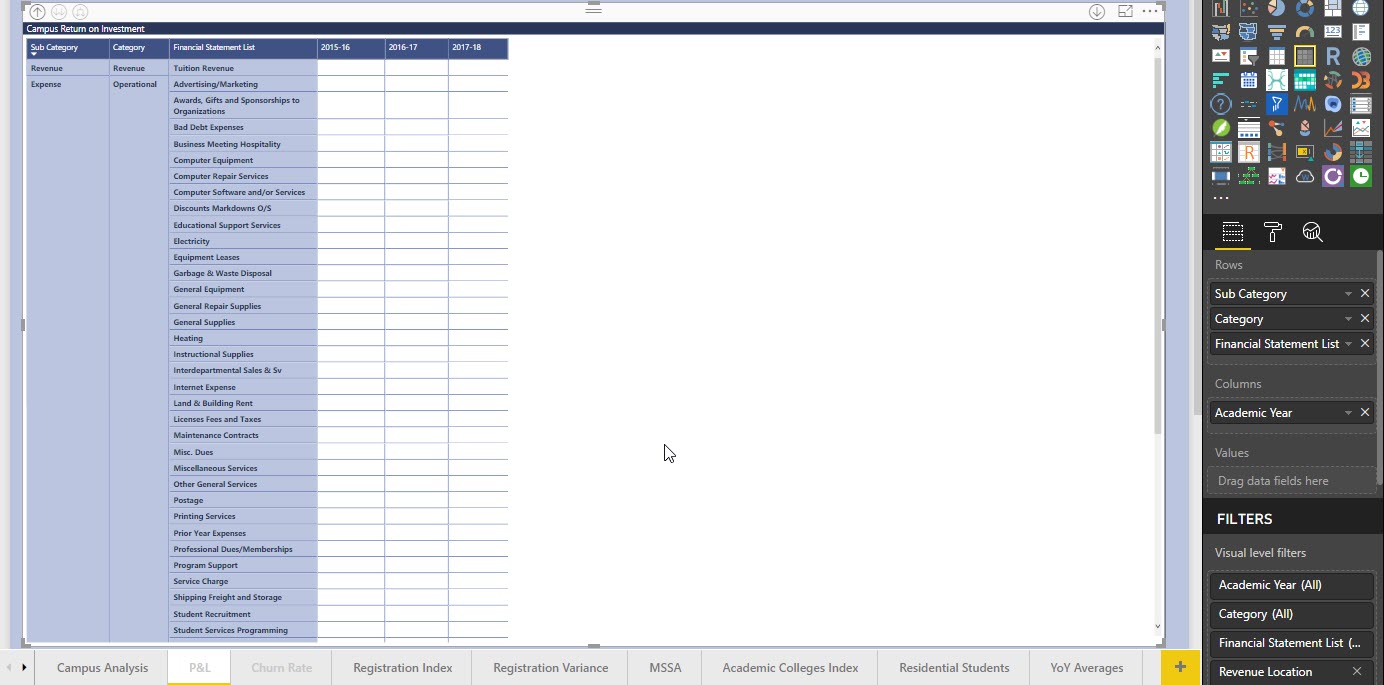
If I remove the [Financial Results] measure from the table then I see all columns like below but of course, there are no values because there is no measure. But this is how the table would look if it were populating the amounts.

There are some months where there is no revenue or expenditures so I dont know if that somehow causes a problem in the output. I just can’t think of what I am missing.

Can we break down one formula or part of the model to focus on.

I don’t really know where to start here, there’s so much that could be the problem. It could be your table, your model, your measure, the context.

Let’s focus on one result in the table and break it down. This is also generally how you should think about looking to solve and audit these problems.

Here is the way to think about these

  1. What is my initial context on this result.
  2. Evaluate where that context comes from and how the relationships in your models are working based on it.
  3. Then think about the measure and how it would be affected by the initial context
  4. Then think what the measure is doing in that context.

If you are receiving no results it is highly likely that context and the filters in your model are the problem.

This was my initial thinking so I starting looking at each element in isolation. Since “Revenue” or what would be called “Actuals” works perfectly and breaks down nicely based on the formulas I figured the problem couldn’t be associated with it.

So I started looking at expenditures in isolation and that’s where the problem resides. At least from the very basic troubleshooting of taking each element in steps. When creating a matrix based on WW Revenue and WW Expenses everything checks out.

Below is my model. A little lead into why it has so much going on is because its a model that started very simple and matured overtime to be able to access the complex questions facing the organization. I even went from having a single Key Measures table to have more than one that groups measures based on their use type:

  • Key Measures - Financial
  • Key Measures - General
  • Key Measures - Variances

Taking this approach just help me keep things clean and ensure at no time I used the wrong measure. Also another caveat to my model is that I created an in-memory table called “Academic Year” because the Dates Table while the master table for all date information did not work with data tables such as Completed Courses which do not have individual dates only academic years and since one table must have unique values thus the Academic Year Table was born to overcome this. But it was placed above the Dates Table so that Academic Year would also be the senior most filter because we always evaluate data in terms of academic years and then for those applicable tables like WW Registrations we will evaluate data based on Term (a month is considered a term).

There is more explanation I can give to the model but it’s not really relevant to this particular case and I don’t want to bore you with too many details.

My first deviation from the training videos is that my revenue data only has actuals because budgeted amounts are done for the year not the month so it would have been difficult to align this data and ensure I came to the same output as the video training.

My second deviation is likely in the training video that I am hoping there will be a sample file posted to follow along with. I believe that the problem is in the table ‘Location Expenses’ which is born out of my ‘WW Expenses’ table and how I had to force an output from my ‘WW Registrations’ that allowed me to create a ‘WW Revenue’ table because revenue is derived from the tuition paid by student per registration which is in the ‘WW Registration’ table. We only have one Revenue type and that is Tuition Revenue. But the creation of the ‘WW Revenue’ table is how I created the ‘Location Revenue’ table that would be unioned with ‘Location Expenses’ to create the ‘Financial Details’ table. The number of jumps is where I have lost focus and context because I am trying to think about it all together.

So here is the context:

  • WW Registrations -> WW Revenue -> Location Revenue
  • WW Expenses -> Location Expenses
  • Location Expenses (union) Location Revenue -> Financial Details

The ‘Dates’ and ‘Financial Category’ tables are used to filter the ‘Financial Details’ table. Should the ‘Dates’ table be the only table used to filter ‘Financial Details’?

Overall I think your model looks great, and by what’s you’ve explained you have got the setup quite efficient.

This specific resource will be available to all members straight after the next summit event which is next week. I have a whole session on financial reporting planned that will run through many things around financial analysis techniques.

If you’re still not seeing results, try every dimension you’re using as a filter and look to see where it’s falling over.

If you locate the individual dimension that is the problem, go back to your model and look where it is and make sure it sits across you lookup table somewhere and is filtering the correct tables below it.

Where ever possible try get your filters to flow downwards like a waterfall. To me, you’re pretty much there. It’s looking good.