Hello @ysherriff,
Thank You for posting your query onto the Forum.
In this case, “ISINSCOPE()” function doesn’t have anything to do with fixing the grand totals. This function checks the validity of the condition at each line item level whether it satifies or not i.e., whether “Campaigns[BC #]” exists at line item level or not and provides the results accordingly.
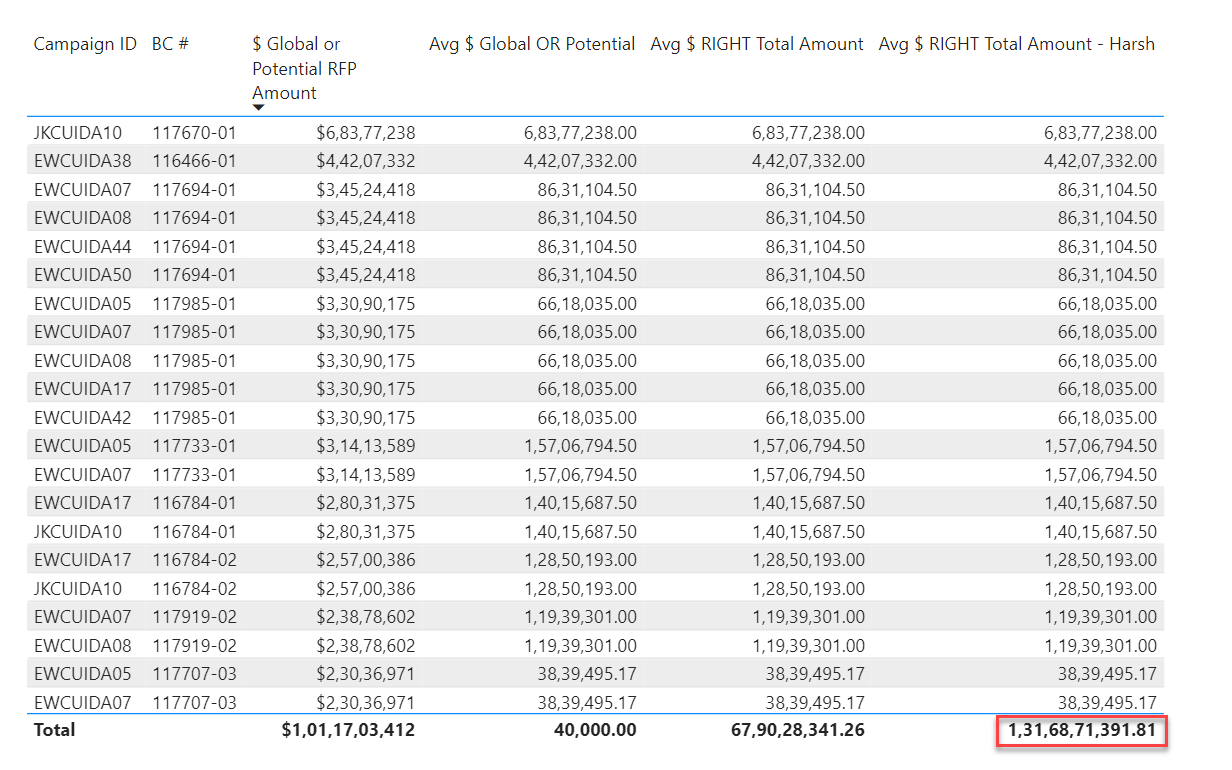
Since you’re putting two fields inside the table visual i.e., “Campaign ID” and “BC #” but inside the measure only “BC #” is considered in the form of “VALUES( Campaigns[BC #] )”. This would’ve been true, only if you’re putting that single field inside the table visual and then evaluating the totals. But in this case, since you’re considering more than one field then context also needs to be adjusted in accordance with that. Below is the revised measure alongwith the screenshot of the final results provided for the reference -
Avg $ RIGHT Total Amount - Harsh =
IF( ISINSCOPE( Campaigns[Campaign ID] ) ,
    [Avg $ Global OR Potential] ,
    SUMX(
        ADDCOLUMNS(
            SUMMARIZE(
                Campaigns ,
                Campaigns[Campaign ID] ,
                Campaigns[BC #] ) ,
            "@Totals" ,
            [Avg $ Global OR Potential] ) ,
        [@Totals] ) )
I’m also attaching the working of PBIX file alongwith the link of a post on topic - “Fix Incorrect Totals” for reference purposes.
Hoping you find this useful and meets your requirements that you’ve been looking for.
Thanks and Warm Regards,
Harsh
WIP - Harsh.pbix (18.0 MB)