Hi There,
We are trialling the Analyze in Excel or also the PowerBI Publisher for Excel functionality for the content pack/apps we are releasing to our end users/customers.
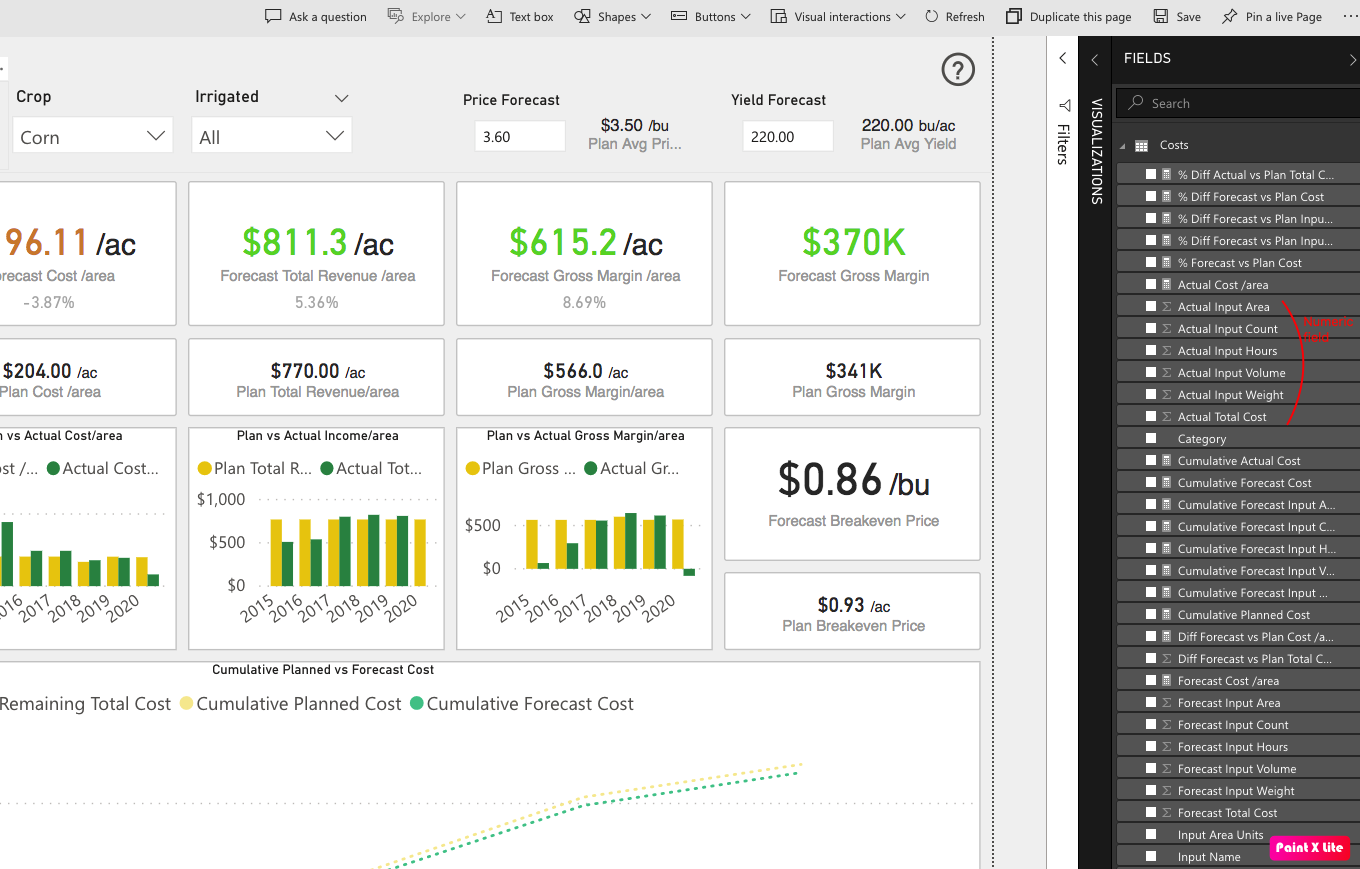
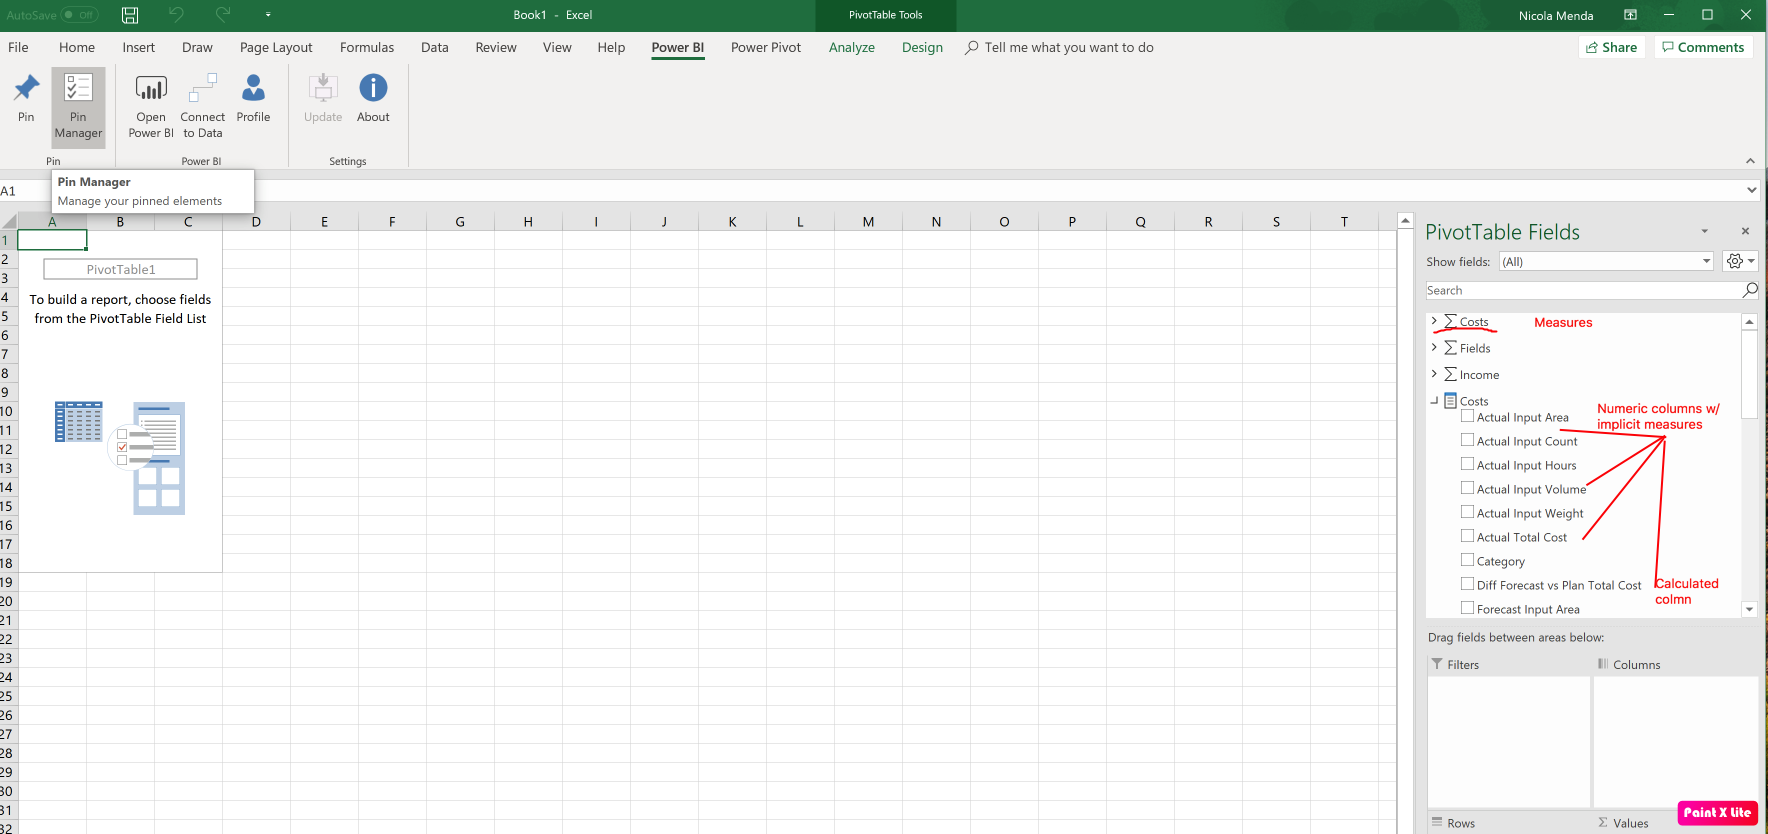
As shown in the Screenshots when using either of these two features the numeric data in PBI (marked by sigma) just shows up as text in the pivot table . I understand this is because implicit measures are created for these fields in PBI and hence Pivot in Excel doesn’t pull these through. The only way would be to create measures for each field so that it can be used in the Values area in Pivot. However we cannot create measures for each of these fields due to the number of numeric columns in each table. And also because we cannot predict what implicit measure the end user would want for that particular field ( as this is going to be an app that they can then use to connect with other data or also perform their own analysis on)
So is there a way for the end user to create a measure in Pivot in Excel for these non measure fields?For eg can I create a Sum of Actual Total Cost from the field Actual Total Cost in Excel itself after the data has been brought in from PowerBI.