How To Calculate Number Of Completed Courses Per Student - Dynamic Grouping In Power BI using DAX

Is it possible to Count the number of registrations by student without having to create a calculated table?

What I have setup from my ‘Registrations’ table is a calculated table using the following:

Completed Courses = SUMMARIZE('Registrations','Registrations'[Student ID],'Registrations'[Term - Academic Plan No Roll-up], 'Registrations'[Academic Year], 'Registrations'[Term Academic Career], Registrations[Gender Description], Registrations[Age Groups], "Completed Courses", COUNTA('Registrations'[Student ID]) )

My goal is to get “Completed Courses” by student and then be able to use things like, Academic Year (to see the number of courses completed in a given year), Gender, Age Group, Academic Career, Academic Plan, to see if there are any patterns between any of these factors and the number of completed courses.

I have this information by using a Calculated Table, I just didn’t know if there is a better approach in getting this.

You could just wrap that table in COUNTROWS(…) and place this into a measure.

In future, need more information in each post. Images etc of the model, the visual you need etc. All of this matters for every calculation and will up answers. Thanks

Sorry about that. I struggle with what details are essential versus not. So imaging the COUNTROWS(…) measure.

I have a measure that counts total registrations which looks like : Total Registrations = COUNTROWS(Registrations).

So would the count of registrations by unique student just be adding a filter into the measure. A new measure that is Total Registrations by Student.

This i probably butchering the syntax all together but thinking out loud:

Total Registrations by Unique Student = COUNTROWS(FILTER(Registrations, Registrations[Student ID]))

Then I can throw this into a table with academic year and the actual student ID so the output looks something like this which counts the completed courses in an academic year.

But now that this is a measure. I need to create a grouping or a way to group this by number of completed courses.
So basically a grouping that is 1 to 25
1
2
3
4
5
6
7
8
9
10
etc.

I cant group a measure so what other factor would I use to create a grouping column?

Visually, below is what I want to create. Where the row header is nothing more than a grouping from 1 to 24. Then when adding the academic year and the Total Registrations by Unique student I would see account of students appear in values next to the number of completed courses in an academic year. So when you look at 2012-13, 2 students completed 21 courses.

I think you have it right there. It’s just COUNTROWS( Registrations )…simple as that.

You have understand the ‘initial context’ which is the student ID, this then filter the registration table I presume due to the model.

Then the calculation is running.

So that should do it, I would say.

So have you already got this, as your image looks like you’ve solved it already…What am I missing?

You can group a measure, it just takes working with the model and some advanced DAX.

See this example

I have not. The table was created using an approach that creates a calculated table by summarizing the ‘Registrations’ table. I am trying to do what you did in the video you shared on Dynamic Grouping but I am hitting a mental roadblock with it.

I created a table called 'Count of Courses". But unlike in your table there is no minimum and maximum as the count of courses will equal the one value. Unless I should just remove the “Less than or equal to” and just say “less than.”

So I get into the calculation and get confused.

The “Total Registrations by Unique Student” is a measure I created using the following:

Total Registrations by Unique Student = COUNTROWS(FILTER(Registrations, Registrations[Student ID]))

Ok I am missing something here major. The output is the total registrations in an academic year instead of an output of total students by the number of completed courses in an academic year.

2016-17 overall total should be 23,260 instead of 86,428 as an example.

Hi Jmwdba,

There must be a easier way to achieve what you want. I personally wouldn’t take the summarise approach but saying that i still don’t quite understand your situation.

Can you a picture of your columns from your original data source before you summarised it?
I’m guessing there a field for date registered, course completed or not and or completion date?
If there is you could countrows and filer on their completion status.

is there a enrolment id that is specific to that individual?

I’m honestly quite lost as to what you need.

In the above your min and max would be 0 - 1 / 1 - 2 / 2 - 3

What your attempting to do is quite complex, and you’re really jumping in the deep end without a sound base knowledge of what is happening within the formula and the model.

I’m going to need more context around the tables and current model.

What columns are the calculation being completed over and what do they look like.

So below is a screenshot of the columns in the registration table. Unfortunately I have removed all of the fields that I don’t need and the ones remaining are used in different visuals within the report. But for this specific need You will seen each line is a registration from a student and its connected to the ‘Student’ table

I also created a table for Completed Courses with the Minimum and Maximum Columns.

Thinking about the formula you performed in the video I tried to think of it from the perspective of my variables and I think thats where I am going wrong. I am not trying to group by unit price rather the count of completed courses.

So thats where I thought first I needed the formula Total Registrations by Unique Student = COUNTROWS(FILTER(Registrations, Registrations[Student ID]))

But then thinking about total sales I looked at what is my equivalent of sales and that would be Total Registrations = COUNTROWS(Registrations).

After that I think is where I went completely off the rails in over-thinking and unable to find my way back. So that my output results in a table that has a Column for “Completed Courses” and would then tally the number of students that corresponds to that number of completed courses by academic year (academic years as columns.

I factored that I would be calculating Total Registrations but iterate through the Student ID column because I want every unique student ID whose count of registrations is included in one of the ranges established on the ‘Count of Courses’ table.

I wanted to make this approach work if possible because my registrations table is 600,000 plus rows of data. My last resort is to just stick with the summarize table route, which does work but eats up valuable file size.

I’m still quite confused as the what you need.

I can’t see anything from your image of the columns because it’s to big.

This formula - COUNTROWS(FILTER(Registrations, Registrations[Student ID]))

Should just be written like this COUNTROWS( VALUES( Registrations[Student ID]) )

This will be calculating the total number of students within the current context.

If you want total registrations then something as simple as this will do it COUNTROWS( Registrations )

Is there a column which says if a registration was actually completed? That would help.

Then you formula would be simple from there

Just

CALCULATE( COUNTROWS( Registrations ), FILTER( ........completed course logic..........))

1 Like

I think this may be one that I have to abandon. There is no column that says a registration complete because by virtue of the registration being the table (each row is a registration) its a completed registration.

The columns used in this exercise from the massive table or registrations are:
Academic Year (identified as 2015-16, 2016-17, 2017-18…)
Student ID (unique 7 digit number assigned to the student. Each duplication of this number is a registration completed by the student so in an academic year if their ID appears 12 times, that means they took 12 courses. This is counted by academic year.)

Registration Count (this column places a 1 for each registration which is represented by a row so 86,000 lines/rows would have a 1 signifying 86,000 registrations).

I created a dummy file that cuts down to the fields that are being used or need to be used.

File: https://myerauedu-my.sharepoint.com/personal/willij42_erau_edu/Documents/Dummy%20Completed%20Courses%20File.xlsx?web=1

The first thing I would do is look at the count of completed courses in an Academic Year broken down by the individual student. Then I would look at it by course then I would look at it by the Term Student Location. But the overall picture is to look at the number of completed courses student within a given academic year.

Unfortunately the link doesn’t work due to access issues.

Try this one: https://drive.google.com/file/d/1GejPs3LlQ5txgHjoULKW-CXok3Jeecei/view?usp=sharing

I moved it to my Google Drive.

Ok please see below and I’ll place a link to the model
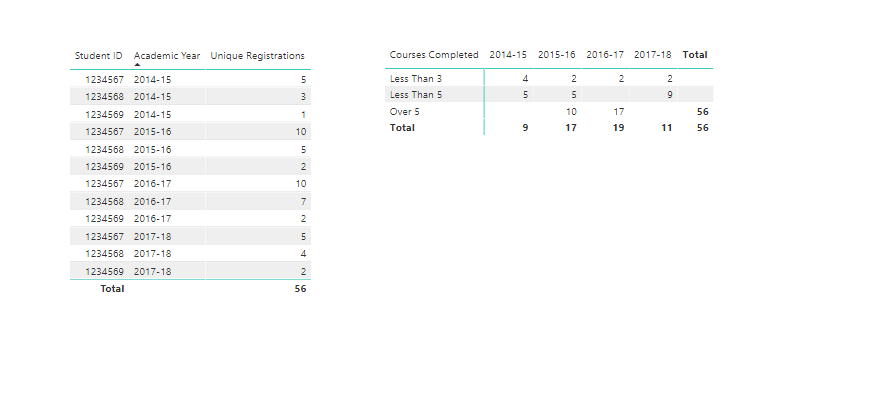
This is the output

These are all the formula you need

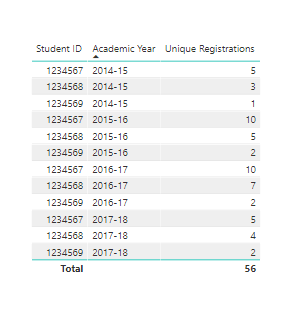
Unique Students = COUNTROWS( VALUES( 'Registration Data'[Student ID] ) )

Unique Registrations = COUNTROWS( 'Registration Data' )

image

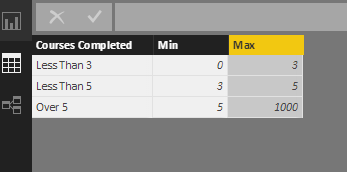
Now to get the table you need to use some advanced logic. This is exactly the same as the dynamic grouping technique explained here

Need to create a table like this (doesn’t have to be exact, but close enough)

image

Then use a formula like this

Courses Completed = 
CALCULATE( [Unique Registrations],
    FILTER( VALUES( 'Registration Data'[Student ID] ),
        COUNTROWS(
             FILTER( 'Completed Courses Grouping',
                 [Unique Registrations] > 'Completed Courses Grouping'[Min] &&
                 [Unique Registrations] <= 'Completed Courses Grouping'[Max] ) ) > 0 ) )

This will give you this

image

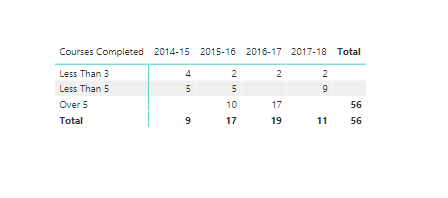
Which I believe is what you need based on the logic you have explained.

Here’s a link to the demo file I created

https://enterprisedna.co/wp-content/uploads/2018/03/Academic-data.zip

1 Like

Yes this is it!!! You are heaven-sent!!!

Hi Sam,

Your dynamic grouping videos are excellent.
I’m having to really up my game to understand PowerBI, as executing this type of analysis lies at an intersection of so many concepts - the data model, evaluation context etc.

Although I prefer to add tables using DAX, as opposed to the ‘Enter Data’ approach, as its easier to amend the table later on as needed, without upsetting the model.

There are probably other ways, but I’ve been using this code (I found it somewhere) to add tables manually:

  • I can tweak it as necessary without having to delete the table & re-enter with ‘enter data’

Regards,
Brendon

image

Yep that’s fine, but it is also seriously easy to make small changes to the table you create using ‘enter data’ within the query editor.

Where you idea certainly is better is if those numbers need to be dynamic in some way. You might want to derive then based off percentages for example.

1 Like