You can’t have a naked column reference in a DAX measure. To bring a column reference in, you will need to wrap it in a function that provides row context like SELECTEDVALUE or MAX. IntelliSense is smart enough not to allow you to do that, which is why the columns don’t show up there, but they will if you put an aggregator function in front of them.
I’m ready to quit my job. If I scratch this whole thing and rebuild it from the ground up,
will my new measures be tied to a date filter if I put it on a page first or will I have to do exactly what I’m doing now anyway, adding the filters for dates on every one of them?
You’re absolutely right that if you build from scratch with that specification in mind from the beginning, this might be a lot easier. In addition, I’m providing you advice piecemeal, without seeing your data model or your PBIX, which is akin to trying to explain over the phone to someone in a darkened room how to take out someone else’s appendix…
I am actually thinking that may be more efficient. So, would this approach be the way to go?
Start with a new report
Bring in my fresh tables
put a date slicer on one page of a report?? Any page??
Write my measures and they will inherently have the date slicer context?
If I can just copy and paste my measures I can rebuild the visualizations pretty easily.
Currently I am filtering the tables for current month when I load them.
Is that an unnecessary step if I have the date slicer to limit it to the date range for the report?
Thinking ahead when they want previous month data.
What am I not thinking of and what else need I consider?
I’ve done the same thing at times - sometimes just easier to start from scratch than to do a major retrofit like this.
Here are some other thoughts:
Re: filtering tables for current month when loaded - the key question here is whether you might ever want to relax that assumption in this report? If no, then filtering the tables on load (or even better, earlier at the source) is best. I would strongly recommend you take 15 minutes to watch @greg’s
excellent Best Practices part one video posted on YouTube today - he does a great job covering this issue, and many others.
where to put the date slicer? - Slicers only impact the page on which they reside. To get a slicer to work across multiple pages, you need to place that slicer on each page and then synch the slicers . Here’s an excellent video on that topic:
Another thing to consider is filtering via slicers vs. the filter pane (which can span muiltiple pages). This video does a nice job explaining the considerations involved in each.
Great stuff. The one thing that has not jelled yet, and hopefully will, is that the measures can be brought to any page. The page will have the date slider. But I have to create the date slicer first and then write the measure to have the context of the date slicer?
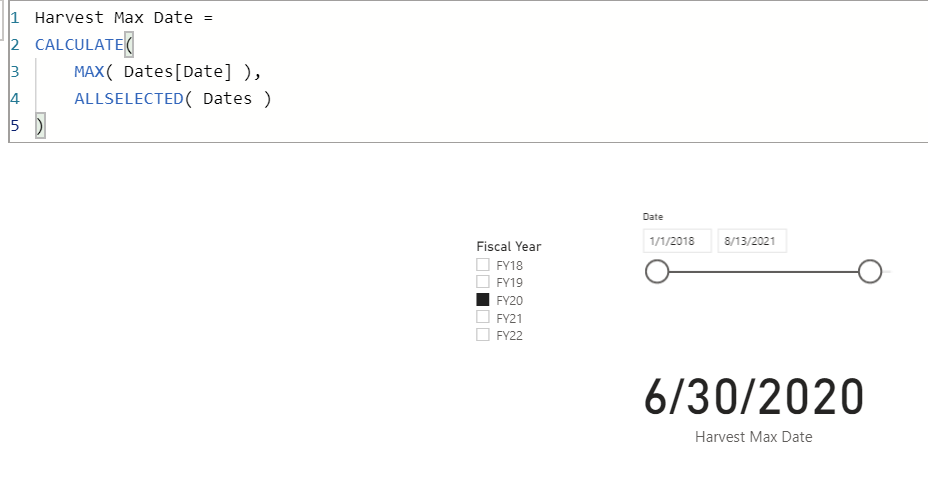
It honestly doesn’t matter which order you create them in – the important thing is that measures always operate within context. For example suppose we have the following date harvest measure:
Harvest Max Date =

CALCULATE(
    MAX( Dates[Date] ),
    ALLSELECTED( Dates )
)
On this page, with only one slicer it returns December 31, 2021.
However, on a different page with multiple slicers, and thus different context, it evaluates to June 30, 2020 even though the measure remains completely unchanged, as does the date slider.
Now by changing the context back, either by manipulating the interaction between visuals via “edit interactions”, or by changing the filter context of the measure or both, we can control which context the measure evaluates and which it ignores. Make sense? Absolutely fundamental concept to understanding and properly applying DAX.
I would definitely recommend going back through @sam.mckay’s Mastering DAX Calculations course. I personally have been through this course four separate times at different points in my training and have picked up new understanding each time through it.
Thanks, I did go back to the context part of the course. And the other videos were very helpful.
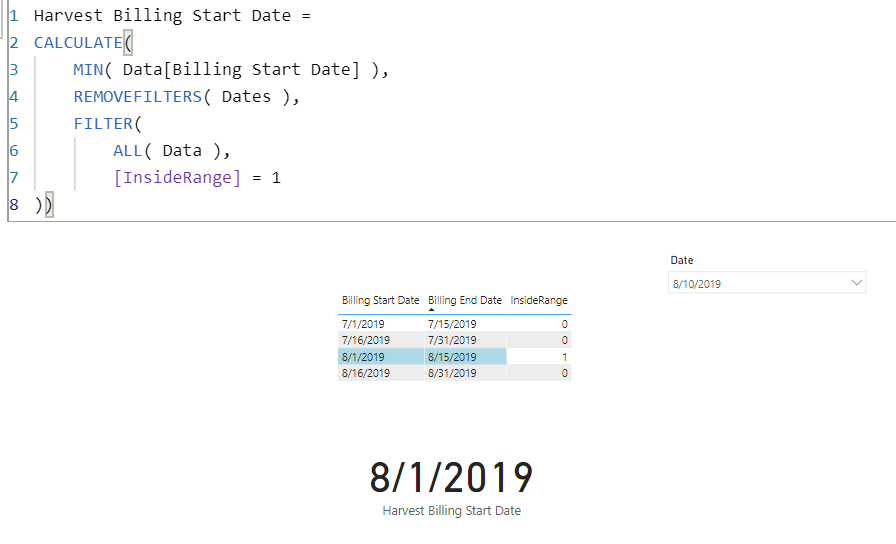
I could not get the table to pull by Billing Period Start and End Dates, using the In Range function from the disconn date table. I expect because all of the measures are built on Bill Date. However, I have been able to add the Bill Date slicer and have the table filter successfully by wrapping those measures in aggregates.
It is not the final solution but it may buy me some more time because of course they needed this yesterday for the new billing cycle.
I could not get the table to pull by Billing Period Start and End Dates, using the In Range function from the disconn date table. I expect because all of the measures are built on Bill Date.
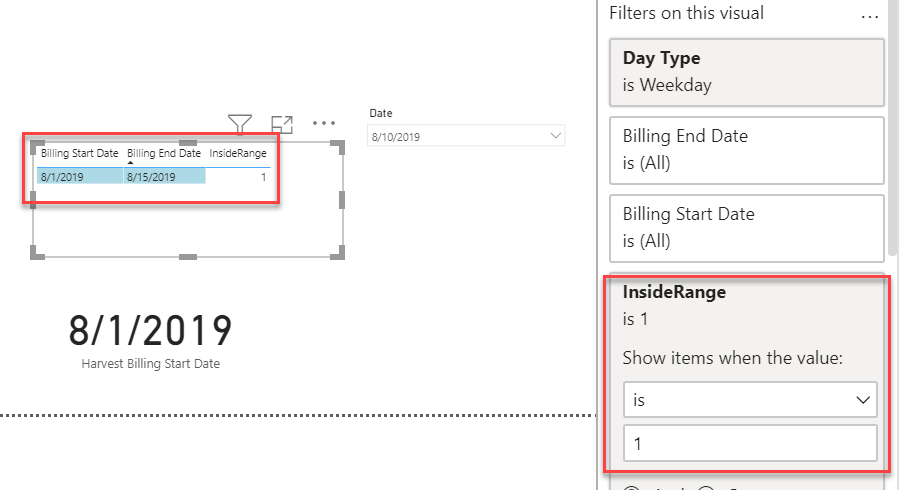
Because there is no relationship between the disconnected date table and the Data table, all filtering is done via DAX and/or through the filter pane. In the above example, I have removed the [Inside Range] = 1 from the filter pane, and just had the harvest start date measure result show in the card and the conditional formatting conditions change the background color for [InsideRange] = 1. However, adding the InsideRange condition back into the filter pane makes it behave like a traditional slicer, actively filtering the table:
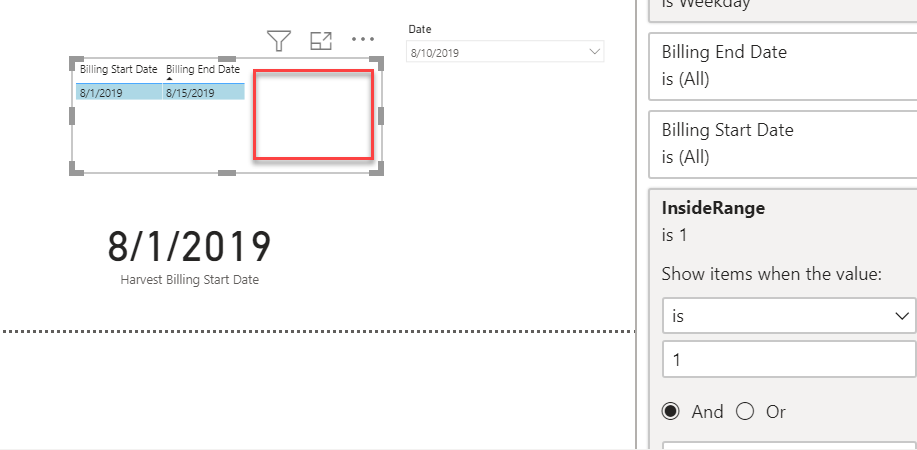
Note that for all of this to work, the InsideRange measure does not even have to appear in the table visual (I had just included it for illustrative purposes):
I hope that clarifies, rather than confuses things… . I’ve attached the modified PBIX file if you want to use ii to play around with some test scenarios.
- good luck. Give a shout if you need any additional help.
FYI - As you can see, the disconnected date table approach is extremely powerful and flexible. The downside is that you don’t have the powerful simplicity of the physical, active relationship to rely on to simplify the DAX. From your initial post, I thought the disconnected table approach was well suited to your requirements, but that’s a judgment call/tradeoff you’ll have to make as you rework this - whether all that flexibility is actually needed, and whether the simplicity tradeoff is worth it.
Hi @LASHBURN, did the response provided by @BrianJ you solve your query? If not, how far did you get and what kind of help you need further? If yes, kindly mark as solution the answer that solved your query. Thanks!
Hi Brian, I ended up letting the user use the date slider for their desired date range, from the current month. Using the harvested dates worked very well as fields above the table to show which date range was selected.
I appreciate all of your help with this. Once I landed it Friday morning, I took the rest of the day off and didn’t even log in until this morning.


")

 - good luck. Give a shout if you need any additional help.