Hi There,
I’m in the process of creating a report that relies on cumulative daily information which is great. There are some pieces of data that are missing and are only provided as a snapshot in time however (not so great) for example:
-
New cases is given in a table showing numbers by day and by region
-
Closed cases is shown as one total figure
This means I am having to create my own table to derive data for closed cases but as I’ve only started, I don’t have the historic data. Nor is the closed cases by region data provided.
All the above is fine when I am showing my report at the top level. However, if you drill into it or apply a slicer, some of the data shown is incorrect because the derived data driven by the total cases is point in time and not cumulative.
There is currently no way for me to obtain the granular detail and build the report as I’d like to so I think my best solution is to turn off some of the interactions within the report. Turning off ALL interactions for a graph is fine, however can I partially turn off some data within a report?
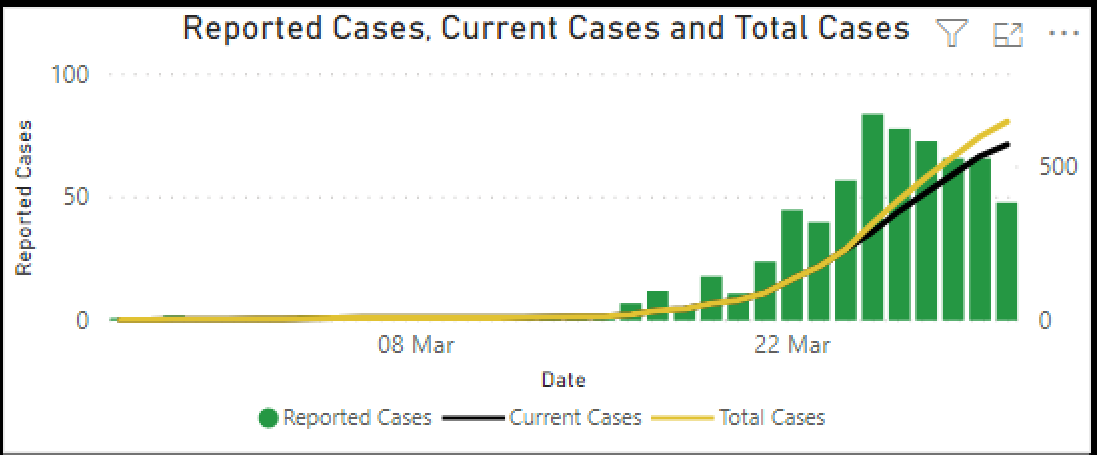
For example: With the below chat, I’d like the line data to have the interactions turned off, but for the bars to remain interactive. I’m certain this is possible as I’ve seen someone else do it previously.
Any help would be hugely appreciated.