Help to properly calculate the Project Completion %

Hello,

I am hoping that someone could please help me shed some light on what I am not doing correctly to obtain the correct percentage for this Project report that I have been working on for days.

I broke down and did a calculated column for the Weight PCT because I had no clue what I was doing in order to write a measure to get these weights to reflect against each deliverable correctly and then to calculate this weight for the overall project completion. I feel like such a failure and I will never understand DAX fully even after going through all the Enterprise DAX courses. It’s so hard to learn. I am trying to follow Sam’s tips for keeping it simple but then when I go and try and apply the formula to my own pbix files they don’t seem to work for me. I know eventually, I will get it and I won’t give up but honestly, it’s so hard.

Even if you could point me to the correct video to watch that would be great and I would be so grateful.
CBC Vizrt Upgrade Project (11).xlsx (267.8 KB)

Hi @joanne.osborne,

To allow forum members to better assist you please provide a PBIX file with the work you have already done, a mock up of the desired outcome and and the visual you intend to use in your report.

Thank you

@joanne.osborne,

I’m happy to work with you on this. I’ve spent a while looking at your Excel data and have a number of questions, but before listing those out for you, it probably would help me to see your PBIX file. If you could please upload that file, that would be great.

@AntrikshSharma and I were just talking today with another member going through similar difficulties with DAX. Know that we’ve all been in exactly the place you are now. Keep at it, and it will start clicking into place.

Here’s an article you may appreciate, written by one of the foremost DAX experts in the world about why DAX is challenging to learn:

  • Brian
1 Like

Totally agree with Brian. In the same article you will find my comment too and you will see how subtle DAX is, the same function performs 2 different things at 2 different places, on top of it CALCULATE does its own N things, then their is nesting of functions or evaluation context. That’s why DAX appears to be difficult.

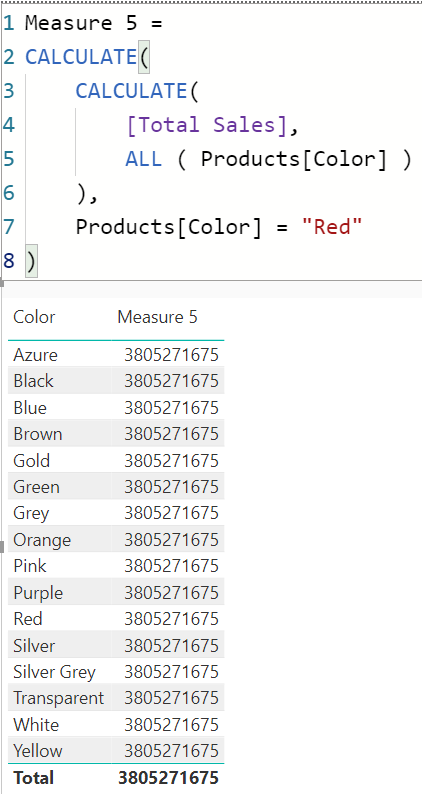
Look at the below image and if I ask you how this measure works, then you would probably say: first, ALL in the inner CALCULATE removes filter from product color column and then the outer CACLUATE returns the value of product Red, right?

NO! that’s not how it works :frowning: . First it creates a filter context containing Red color and then inner CALCULATE removes all the filters from the product color column and then at the end CALCULATE evaluates Total Sales in a filter context where colors are not filtered.

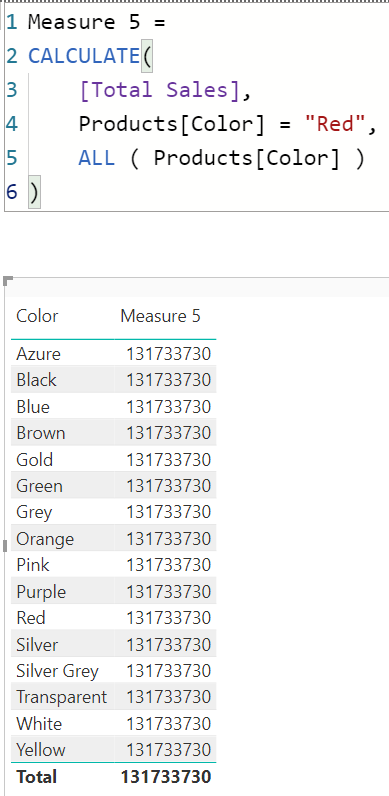
Now if I merge 2 CALCULATE I get the correct result, why? even though ALL is still in the code? Here is why: CALCULATE Mantra

First Products[Color] = “Red” is evaluated in the initial filter context and the values are kept aside for a moment, then ALL removes all the filters from the Products[Color] column and at the end Products[Color] = “Red” is applied to the filter context, within which Total Sales is evaluated.

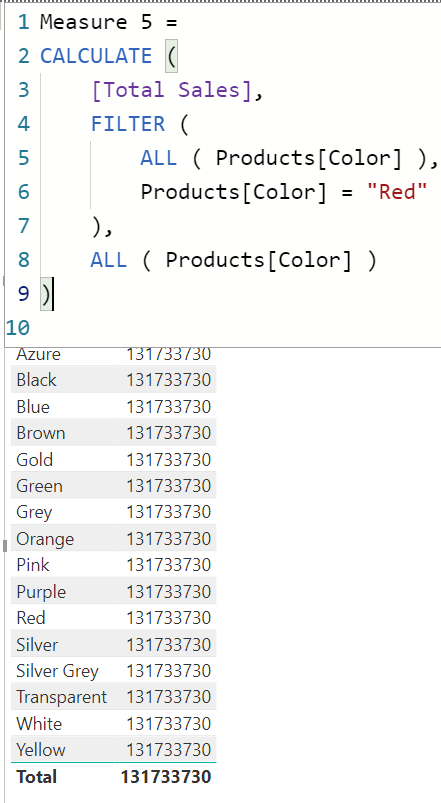
To make you more confused(not the intention but just to amaze you): When you write Products[Color] = “Red” internally engine expands this predicate/boolean condition to

=
FILTER (
    ALL ( Products[Color] ),
    Products[Color] = "Red"
)

so the expanded version of the code looks like this:

Measure 5 =
CALCULATE (
    [Total Sales],
    FILTER (
        ALL ( Products[Color] ),
        Products[Color] = "Red"
    ),
    ALL ( Products[Color] )
)

The end result is still the same but as I said in the beginning ALL is performing 2 different things in 2 different places, inside FILTER it returns all unique Products[Colors], outside FILTER it is removing filter from Products[Color]

These small things and many other concepts that are not evident at first makes it so confusing but once you understand them you will appreciate how awesome DAX is.

I would suggest you start honing the below topics:

CALCULATE modifiers
Context Transition
Row Context & Filter Context
Nested CALCULATE

Another suggestion: start solving other people’s queries, then only you will get a good grasp of DAX. What works for me is when I provide a solution and that is not the desired one and someone comes in with a perfect solution that is point when I learn more.

Here is post related to context transition that I (BIFanatic) solved on Reddit, it will help you in understanding how context transition works in CALCULATE:

1 Like

Hi Melissa

I’m so sorry, I hope I shared my pbix file correctly.

Vizrt Project.pbix (87.0 KB)
CBC Vizrt Upgrade Project (11).xlsx (267.8 KB) Deliverable Weighting.xlsx (8.7 KB)

Thank you so much
Joanne

Thanks, Brian. I agree totally with that statement. I have never had something drive me so crazy, sleepless nights, so much pain and anxiety and yet I love it so much at the same time. I love the challenge of DAX and when that measure finally works or you get the result you’ve been looking for it’s such a great feeling. I have taken all the Enterprise DAX courses and I have the The Definitive Guide to Dax book. I try doing the writing the same DAX measure over and over and over again to memorize them all but at the end of the day, I think it’s just practice, failure, practice, failure, until one beautiful day, it all comes together and you’ve reached that point where I can help others instead of feeling like a failure and only asking for help. It’s hard to ask for help and not feeling like you are giving back any help.

Thanks and have a great day!

1 Like

Hi @joanne.osborne,

No worries. Just one more question - what is the desired outcome?
I see you have those weights in your report but how do you want that Project Completion % figure to be calculated - if you provide a mock up with the expected results, that will be a big help in working out a solution.

Thanks again!

Hi Melissa,

I was hoping to show the results of the Total Project percentage completion so that as they enter the data in the excel spreadsheet and I do a refresh on the pbix file the overall project percentage will show. What messing me up is the weight that has been provided by the manager for each deliverable.

The Toronto VizONE below in the data is completed but its only 10% of the entire project.

I was hoping to show my pbix file the same way with these weighted averages like the visual below. The Regions would show the percentages completed by each weight category deliverable. The project completion would be for the overall completion of the project.

Deliverable 70% - English Vizrt Updates - Engine Image (MSE, 2016, NEW Domain, BIOS and Firmware updates), MSE on Gateway, Artists 10% - VCP DB to VM -Move 2 Pilot DB and Application servers to VM 10% - VizONE Migrate to new Domain - Migrate the VizOne server to the cbc-rc domain 10% - Graphics Hub - Upgrade Graphics Hub servers to Windows 2016

This is an example of another pbix file. It shows the percentages of each legend deliverable.

image.png

Thanks

Kind regards,

Joanne Osborne

Don’t think the image loaded properly - can you try that again?

Hi Antriksh!

Thank you for these great tips and your suggestions. All of these tips help so much. I will definitely look at all of these. I love Reddit and find it a real helpful site. I look forward to working with you and this forum this site. Dax is so fascinating and I am in awe of you and others that have mastered it. I really like learning what’s really happening under the Dax engine covers and wow that’s when it can get confusing.

Thanks again!
Joanne

1 Like

Hi Melissa,

Sorry maybe my snapshot view wouldn’t work this way so I attached this demo pbix file.

I attached a copy of the Demo PBIX and the Excel file for the demo data.

Projects_Demo.pbix (130.7 KB) PowerBI_Project_Template.xlsx (13.6 KB)

Thanks again.
Joanne

Hi @joanne.osborne,

I do apologize maybe my brain is working half speed, I don’t know but it’s still not clear to me what the desired outcome is…

Let’s try something else.
If we look at project completion for Calgary should this be seen as 100% or 80% complete?

Project Completion % should that be calculated differently for certain levels?
Deliverable / (Parent) Region
Region / All Regions

Again if you could provide a mock up of the expected results in excel or whatever - that be very helpful
Thanks!

Hi Melissa,

Sorry, when I showed my pbix report to the manager he told me that he wanted to see the overall project % status by each deliverable and also by each Region. To make it more confusing he assigned the weight.

I was really confused too it’s not you trust me. :wink:

For example he weighted each deliverable.

All the Regional Graphics Hub is 10% of the Total overall project so even though Calgary is completed for Graphics Hub the other Regions haven’t been completed yet. He said you have to add up the completed and then divide that number by 10% to get the overall project % for the Deliverable for Graphic Hub. The same would apply to the other Deliverables. I know it’s very confusing. I do apologize. Calgary overall would be total 80% complete once both deliverables are done.

I was hoping to see the Projection completion at the project level

The example pbix demo file was a mock-up of an example of what he wants to see. Might not be possible with my data format in power query?

If it’s not possible I totally understand, I have been trying for days to figure it out.

Thanks again for all your help.
Joanne

Okay that is helpful.

Almost forgot to mention, you had created implicit measures by dragging fields into the value section of the matrix. For example I have replaced Completed with:

Completed = 
    SUMX(
        'Vizrt data Power BI',
        'Vizrt data Power BI'[Total Activies Completed "Done"]
    )

and repeated this for Required and Remaining as well.

Next add this measure to your matrix table and let me know if that makes sense to you.

Total Project Completion % = 
VAR vTableDeliverable = 
    ADDCOLUMNS(
        SUMMARIZE( 'Vizrt data Power BI', 
            DateTable[Date], 'Vizrt data Power BI'[Region], 'Vizrt data Power BI'[Deliverable], 'Vizrt data Power BI'[Weight PCT] 
        ), "Value", [Weight PCT] * DIVIDE( [Completed], [Required] )
    )
VAR ResultDeliverable = SUMX( vTableDeliverable, [Value] )
VAR vTableTotal =
    ADDCOLUMNS(
        DISTINCT(
            SELECTCOLUMNS( 'Vizrt data Power BI', 
                "_Deliverable", [Deliverable],
                "_PCT", [Weight PCT]
            )),
        "Value", DIVIDE( [_PCT], [Completed], 0 )
    )
RETURN

IF( ISINSCOPE( 'Vizrt data Power BI'[Deliverable] ),
    ResultDeliverable,
    SUMX( vTableTotal, [Value] )
)

Result.

It will also work in a card visual, if that is required.
I hope this is helpful.

3 Likes

@Melissa,

Great solution to an unexpectedly complex problem.

@joanne.osborne - looking forward , I wanted to share the following video with you that contains a series of structured practice techniques that have all really helped me improve my DAX skills over the year+ that I’ve been doing them. I hope you find them helpful too:

  • Brian
2 Likes

Thanks, Brian. I will definitely check it out. Much appreciated.

Hi @joanne.osborne, did the response provided by the contributors help you solve your query? If not, how far did you get, and what kind of help you need further? If yes, kindly mark the thread as solved. Thanks!