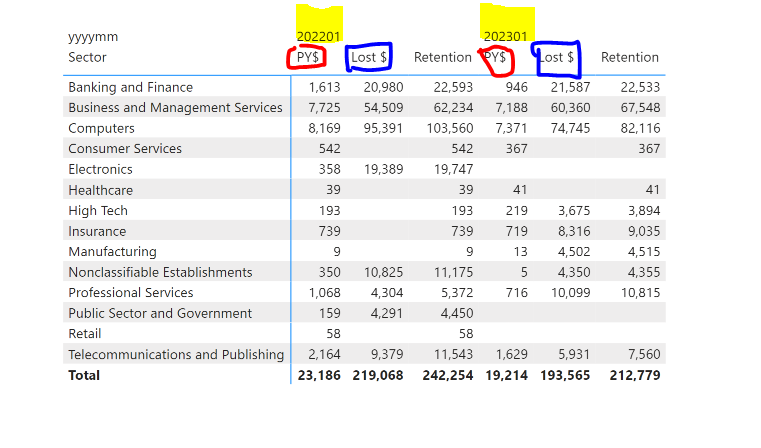
Per the attached sample .pbix, I’m looking for dax measures or another method, that will group like measures together for comparison, instead of what I currently have the measures are within each year.
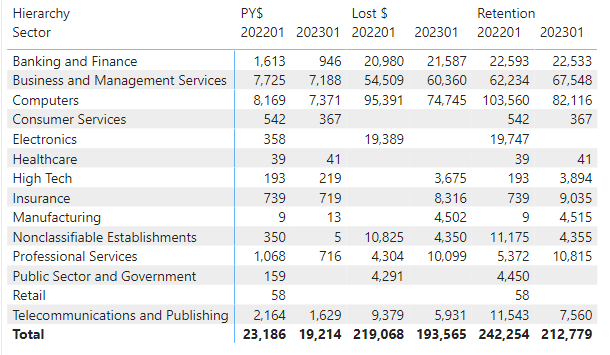
Per each Sector I would like to see PY$ 2022 and PY$ 2023 next to each other - so on and so forth
Please advise of any questions, much appreciate your time!
@ambidextrousmentally That’s not possible, Visuals are built internally by the Power BI Engine by joining the Rows and Columns based on an Index, currently there is not way to modify this.
Just following up if the response above helps you solve your inquiry.
If it did, please mark his answer as the SOLUTION.
We’ve noticed that no response was received from you on the post above. If there won’t be any activity in the next few days, we’ll tag this post as Solved.
Due to inactivity, a response on this post has been tagged as “Solution”.
If you have a follow question or concern related to this topic, please remove the Solution tag first by clicking the three dots beside Reply and then untick the check box.