Grouping table with extra group

Hi,

When grouping my data, I’m using a grouping table like usual Sam’s did. Question comes to mine is, what if there is some data outside of the group, how would be the measure looks like ?

My measure I usually use is like this :

Aging QTY = 
                CALCULATE(
                    SUM('Transactions'[Quantity]),
                    FILTER(
                            'Transaction',
                            COUNTROWS(
                                        FILTER('Aging',
                                        'Transactions'[Aging days] >= 'Aging'[From] &&
                                        'Transactions'[Aging days] <= 'Aging'[To]
                                        )
                            ) > 0
                    )                
)

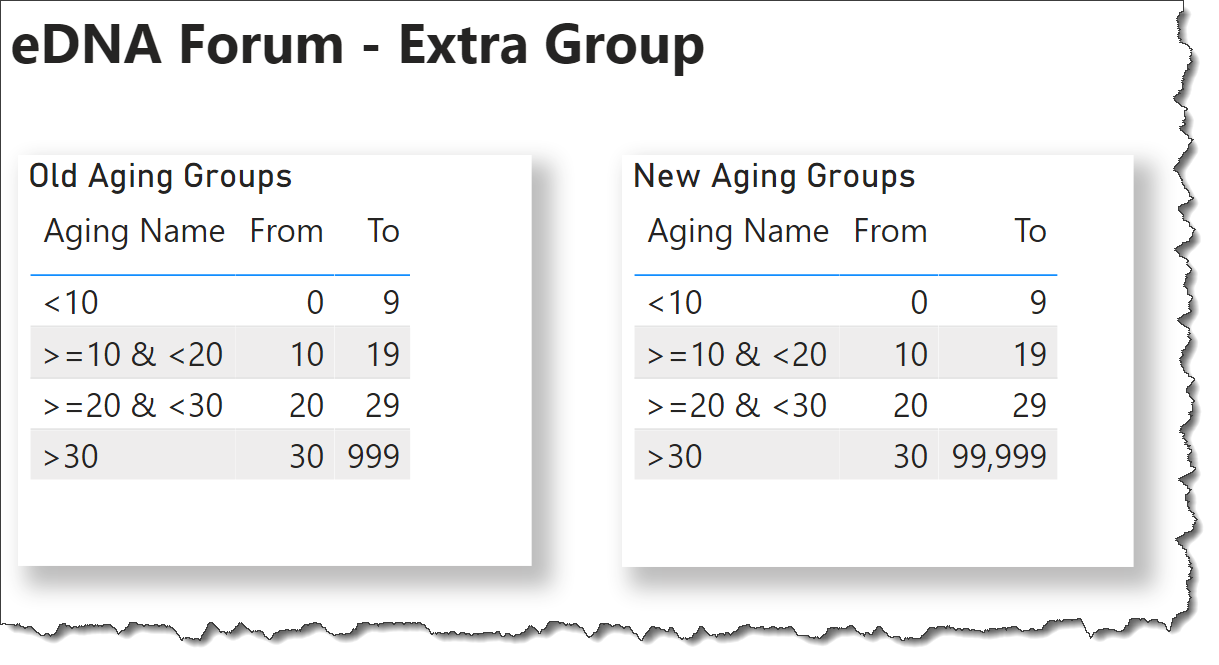
My grouping table is like this :
image
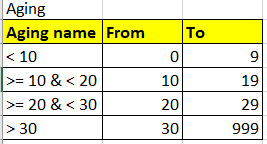
And it turns out I have data with aging more than 999, like 9,999 or 99,999
I know I can just add the last record to be bigger number, but unfortunately I can’t, because this is a share table, if I add another row, it will make other report using it, changed as well, which I don’t want.

Is there a possibility that a measure can cater that extra ? so like everything over 999 (the biggest range in my table), the measure can add extra group like “Over range”, something like that, so it will put into this extra group instead.

Thanks,

Hi @Toni. If you don’t want to change the shared table, can you create a calculated table off of the shared table, adjust the last row as desired, and use that in your report/measures instead?
Greg

Hi Greg,

Means using CALCULATETABLE I can add rows from the shared table? I rarely use this function and as I learn just now, it is more like SUMMARIZE, no idea how to add rows though.
Any sample how to do it?

Thanks,

Hi @Toni.

Here’s one way you can take your old aging groups table and create a new one to suit your report:

  1. filter out the row(s) you don’t want from the old table
  2. create a row(s) of the values you do want
  3. UNION the two

Something like,

New Aging Groups = 
VAR _vOldTableNo30 = CALCULATETABLE( 'Old Aging Groups',
    FILTER( 'Old Aging Groups',
        'Old Aging Groups'[Aging Name] <> ">30" )
) 
VAR _VNewTable30 = ROW(
    "Aging Name", ">30", 
    "From", 30,
    "To", 99999
) 
VAR _vNewTable = UNION( _vOldTableNo30, _VNewTable30 ) 

RETURN
_vNewTable

This produces this new table:

Hope this helps.
Greg
eDNA Forum - Extra Group.pbix (21.0 KB)

3 Likes

Hi @Toni, did the response provided by @Greg help you solve your query? If not, how far did you get and what kind of help you need further? If yes, kindly mark as solution the answer that solved your query. Thanks!

Hi,
Yes, it is. However, is this possible when I’m using Direct query ? Or is there another workaround of doing that in Direct Query?

Thanks,