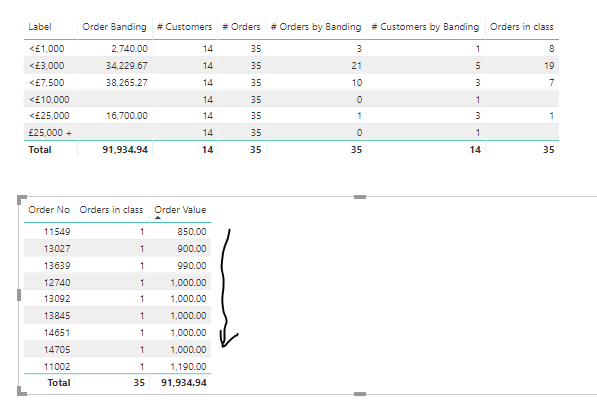
I want to create the following table (extract - see attached model for detail)
Order Banding Order Value # Orders #Customers
£ < 1000 £2740 3 3
£ < 3000 £34229 21 12
Order Value and # Orders both seem to be calculating correctly. #Customers however is not. I want it to return the number of distinct customer ID’s that make up the £2,740 (for eg).
What it appears to be doing is evaluating the banding for the number of customers where their total order value falls within the band rather than looking at the orders that are falling in the band and counting how many customers appear in the filtered context.Dummy-Data-File.pbix (156.1 KB)
Orders by Banding = SUMX('Order Intake',IF([Selected Order Value Metric]>=[BandMin]&&[Selected Order Value Metric]<[BandMax],[Selected # Order Type Metric],0))
but the following doesn’t work for #Customers
Customers by Banding = SUMX(Customer,IF([Selected Order Value Metric]>=[BandMin]&&[Selected Order Value Metric]<[BandMax],[Selected # Customer Type Metric]))
I think this is because it is re-doing the calculation rather than calculating the distinct customers based on the results of the #Orders by Banding metric
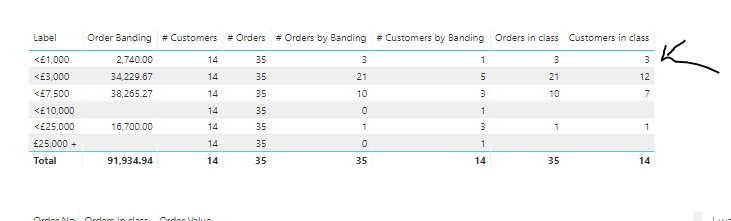
Thanks but Both Orders in Banding and Customers in banding should 3 for the 1st band. I believe the Orders in Banding metric is correct. It is the Customer one that isn’t
This I believe caters for the scenario where an order can have multiple lines and it is the addition of these lines that determines whether it falls within a particular band.
I’m trying to understand. I thought Countrows just counted rows
If the table has
Order 10000 line 1 value £500
Order 10000 line 2 value £600
Order 20000 line 1 value £400
Order 20000 line 2 value £300
Won’t your syntax for number of orders less than £1000 return 4 for the above scenario whereas mine would return 1, ie
Order 10000 total value £1100 therefore excluded
Order 20000 total value £700 therefore included
Ok if that is the logic you are looking for you will need to make some small adjustments to the formula
Understanding context is absolutely key here (outside and inside the formula)
First if you need the unique orders you will want to be using DISTINCTCOUNT instead of COUNTROWS. Then you will also want to reference the exact order ID columns.
You will also probably want to create a measure called Total Order Value (or something like this). This calculation will internally within the formula aggregate up the total amount for each order rather than just at each seperate line.
You’ll the pattern though is exactly the same
See example below.
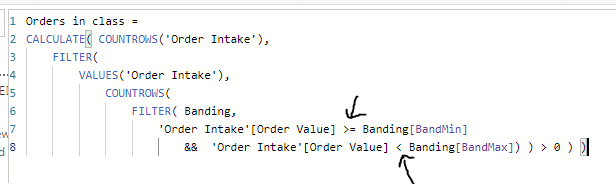
Orders in class =
CALCULATE( DISTINCTCOUNT('Order Intake' Column),
    FILTER(
        VALUES( 'Order Intake' Column ),
            COUNTROWS(
                FILTER( Banding,
                    [Total Order Value] > Banding[BandMin]
                        &&  [Total Order Value] <= Banding[BandMax]) ) > 0 ) )
This should do it.
I haven’t been able to test it, but logically this should work.