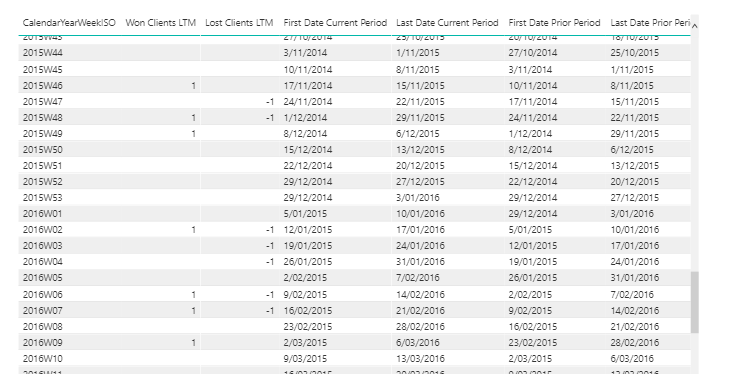
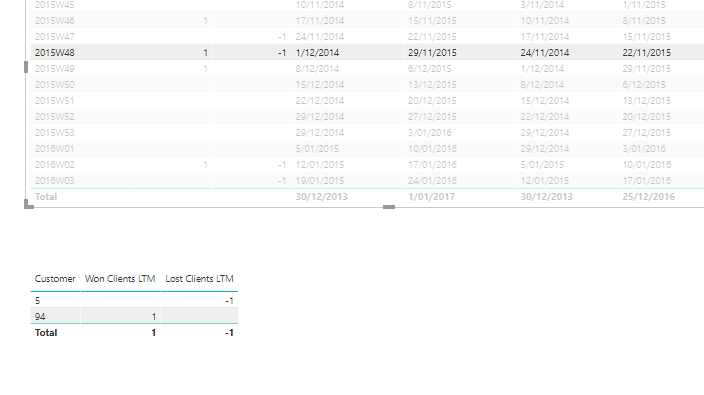
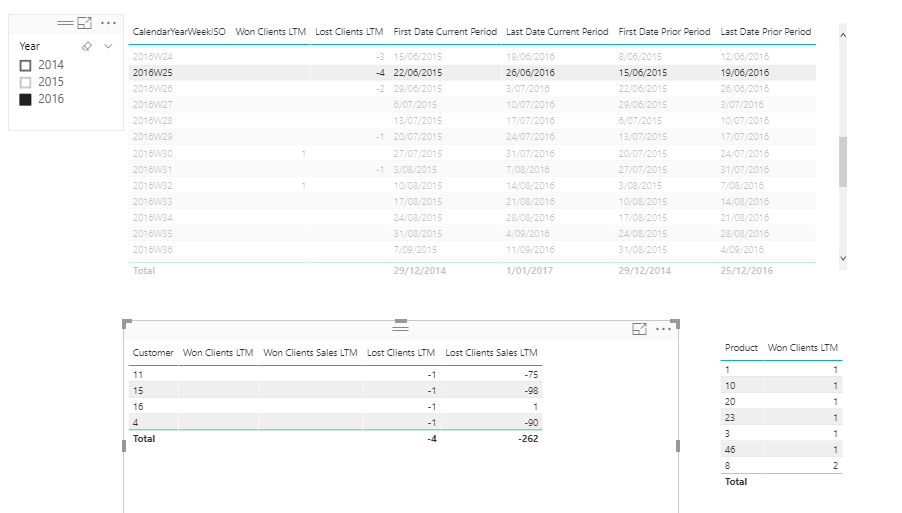
Grand Total (which is correct) is not equal as the addition of the several items

Hi All,

In the next attachment you will find a pbix-file with the calculations of the Churn per week.

181029 YH Churn per week -1W BM_PxQ_Invoices DEMO DATA V2.pbix (724.4 KB)

With this file I want answers for the following 3 questions:

  1. Number and Values of Lost/Won Clients;
  2. Who are my Lost/Won Clients?
  3. On what products did we lose/win on Lost/Won Clients?

I have found the answers for questions 1 and 2, also I’ve found an answer for question 3 but that answer isn’t completely correct. The Grand Total isn’t equal to the addition of the several items.

Let me explain:

Lost Clients - Period 2016W25

Tab “Lost Clients” and tab “Who are my Lost Clients?” are giving the answers for question 1 and 2.
I’ve changed the context in tab “Lost Clients per Product” into Products. The Grand Total is -262 but when you add the several items you will get the result of -261. The difference of 1 is customer 35 with product 59, see

181029 Validate 2016W25 Lost Clients DEMO DATA.xlsx (96.1 KB)

Won Clients - Period 2015W27

Tab “Won Clients” and tab “Who are my Won Clients?” are giving the answers for question 1 and 2.
The Grand Total in tab “Won Clients per Product” is 620 (= correct) but when you add the several items you will get the result of 636. The difference is 16 = the amount of customer 30, product 15.

181029 Validate 2015W27 Won Clients DEMO DATA.xlsx (116.7 KB)

I hope that you understand my problem with this explanation.

What do I have to do to get the correct results by changing the context?

Greetings from The Netherlands,

Cor

Will get to this today. I had another look yesterday and it’s still not 100% clear. But I will give it another attempt shortly. Thanks

Ok to fix this I am getting rid of all the information that isn’t relevant.

I think the hardest thing with this in terms of getting my mind around it is there’s just so much in the model and it can get confusing. I really like to drill into the very specific things we are looking at and avoid any distraction.

These calcs are already quite advanced so the easier I can make it the better.

First I deleted every page, then cleaned up the model a little.

Now I’m only going to look at the singular DAX measure here.

And then I’m going to start breaking it down.

See below.

Is this right? Both the first and last date are feeding into the won clients measure

So we are calculating new client every week
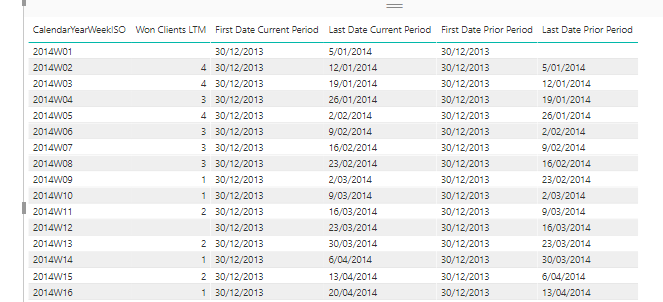
image

Won Clients LTM = 
VAR CustomerLTM = CALCULATETABLE(VALUES('YH Invoices'[Customer]),
                    DATESBETWEEN ('Calendar'[FullDate],
                         [First Date Current Period],[Last Date Current Period]) )
VAR PriorCustomers = CALCULATETABLE(VALUES('YH Invoices'[Customer]),
                       DATESBETWEEN('Calendar'[FullDate],
                        [First Date Prior Period], [Last Date Prior Period] ) )             
RETURN
COUNTROWS(
    EXCEPT(CustomerLTM,PriorCustomers))

Now when I add lost client to the mix

First I would go through and double check all these all calculating correctly here. Maybe you have I’m not sure.

Then I set this up to check around who are won/lost clients.

It is producing a result so might be correct not sure.

Now going into what products

I tried to replicate the scenario

Seems to be showing similar answers which is good.

Expanded on this one.
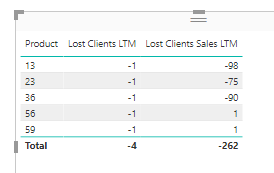
image

Ok then I finally have replicated this also
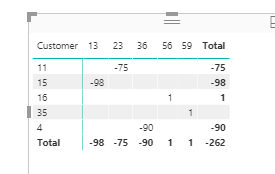
image

Yes and can see the difference between product 35 and 59.

Ok so now need to look back into everything leading up to this number.

Will focus on this one result.

If I look on the face of it interesting to note here the product 59 appears but the total is still 4
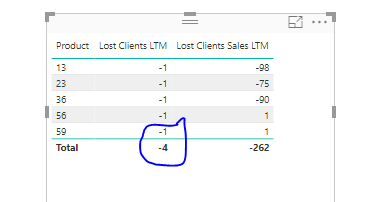
image

So why is that.

Let’s look at the calculation in that context

Lost Clients LTM = 
VAR CustomerLTM = CALCULATETABLE(VALUES('YH Invoices'[Customer]),
                    DATESBETWEEN ('Calendar'[FullDate],
                         [First Date Current Period],[Last Date Current Period]) )
VAR PriorCustomers = CALCULATETABLE(VALUES('YH Invoices'[Customer]),
                       DATESBETWEEN('Calendar'[FullDate],
                        [First Date Prior Period], [Last Date Prior Period] ) )             
RETURN
COUNTROWS(
    EXCEPT(PriorCustomers,CustomerLTM))*-1

At each row we are taking a table of customers and then comparing them to a table of customers from another period.

But we have to remember here the context of this calculation is not only by the date but also by product now as well. So the product index is filtering this calculation also.

I wanted to see this person actual transactions
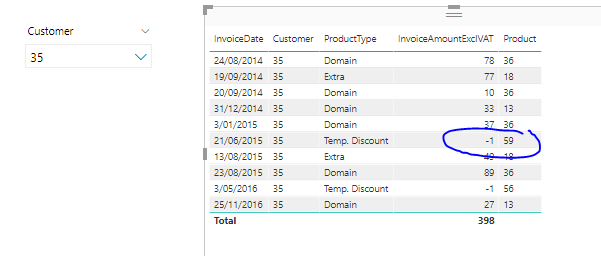
image

Seems this is what is getting picked up.

So why is this?

I’m looking at the date here 21/6/2015 - it was in the PriorCustomers table, but not in the CustomerLTM table,

So in my estimation it is calculating as it should
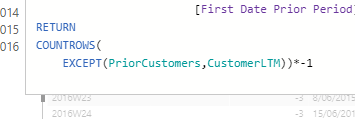
image

So then why isn’t it calculating here?
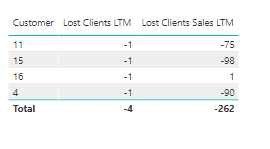
image

My guess is that the customer did actually purchase something else though, which is seems they have
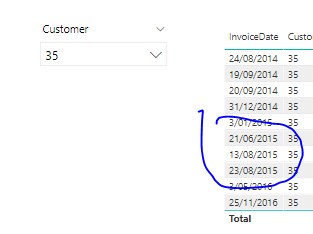
image

So what you’re not taking into account here is the additional filter of the product in my view.

You have to remember that you’re now saying when in the product context has a group of customer bought this particular product again over the time horizon, NOT just anything which is the case when looking at the results against just the customer context.

Ok this is enough for now, I’ve spent a lot of time reviewing this and writing out this answer.

Attached.
181029 YH Churn per week -1W BM_PxQ_Invoices DEMO DATA V2 (2).pbix (251.2 KB)
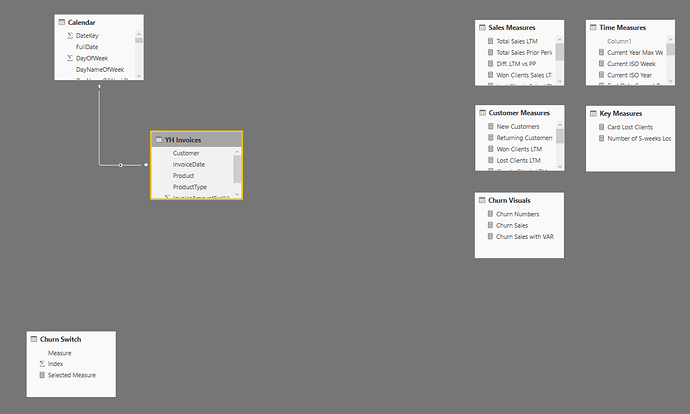
Thank you very much Sam for your comprehensive response to my questions. I really appreciate it and I’m learning a lot :smile:

I am a little bit confused now but I think that we are on our way to solve this problem.

First your question:

I think that customer 35 isn’t mentioned in the visual because customer 35 isn’t a Lost Client, customer 35 is a steady client with Won Revenue Sales LTM, see page 3 from the attachment:

What I do not understand is why customer 35 is mentioned in

181031%20Lost%20Products

Customer 35 is a steady customer and not a lost customer.

I think that by changing the context by adding the product is the reason.

In Excel I’ve made a calculation of the combination of customer-product:

181031 Validate 2016W25 Lost Clients DEMO DATA PRODUCT LEVEL.xlsx (154.8 KB)

These are the combinations of customer-products who/which are lost in 2016W25:

The product 59 was in the prior period and not in the current period (2016W25) so I think that is the reason why product 59 is mentioned in the visual.

The DAX-formula of Lost Clients Sales LTM is looking at the customerlevel and not at the level of products.

Question:
The total Lost Clients Sales LTM is -262, with all mentioned before, is it possible to get the following end-result?

181031%20Endresult%20Wish2

Chrs,

Cor

181031 Sam YH Churn per week -1W BM_PxQ_Invoices DEMO DATA.pbix (266.0 KB)

181031 Validate 2016W25 Lost Clients DEMO DATA PRODUCT LEVEL.xlsx (154.8 KB)

After thinking about this further it does make sense why it is appearing.

I think you’ll probably find many examples of this if you click through a variety of weeks.

The key here is the context of the calculation within the table with each product.

You have to remember here that an additional filter is being placed on the virtual tables within the formula here. That is the additional context of product.

So now these below are not only filtering for every client but also for every client AND every individual product

image

So in theory you will likely always get more results here I believe because of this.

And yep just by testing the next time frame similar results

So the idea here would be to remove the product context somehow in the formula.

I played around with a few ideas and landed on this.

Lost Clients (Testing) = 
VAR CustomerLTM = CALCULATETABLE( CALCULATETABLE( VALUES('YH Invoices'[Customer] ), ALL( 'YH Invoices'[Product] ) ),
                    DATESBETWEEN( 'Calendar'[FullDate],
                         [First Date Current Period], [Last Date Current Period] ) )
VAR PriorCustomers = CALCULATETABLE( VALUES('YH Invoices'[Customer] ),
                       DATESBETWEEN('Calendar'[FullDate],
                        [First Date Prior Period], [Last Date Prior Period] ) )             
RETURN
COUNTROWS( EXCEPT( PriorCustomers, CustomerLTM )) *-1

It’s a small variation on the existing and it seems to work well after testing it.

Chrs

1 Like

As always an awesome solution Sam! Thank you very much.
I’ve learned a lot of you this year, i really appreciate it.

Chrs
Cor

Last question in this topic:
We’ve moved the product context by using another CALCULATETABLE with ALL.
If the context is an hierarchy (for example Producttype-Productname), do you have to put several CALCULATETABLES with ALL into the DAX-formula or is there another solution in case of hierarchies?

Chrs

What I would probably do in this case is move the Product information into a lookup table. It would be a more efficient model this way especially in you had more information about a particular product than just the name or index number.

When you do this then inside of ALL your would just place the product table and not have to worry about any individual columns.

See how you go with this.

Hi Sam, I’ve moved the Product information into another lookup table and I’ve changed the DAX-formulas. The result was correct, thank you for pushing me the right way! :smile:

That’s great. Chrs