I already tried to solve the problem using three different approachs.
. Using the LOOKUPVALUE function
. Using an X function after using the SUMMARIZE function
. Using an X function after using the FILTER function with the ALL
I wasn´t able to get what I want.
Could you give me some clues that can help me?
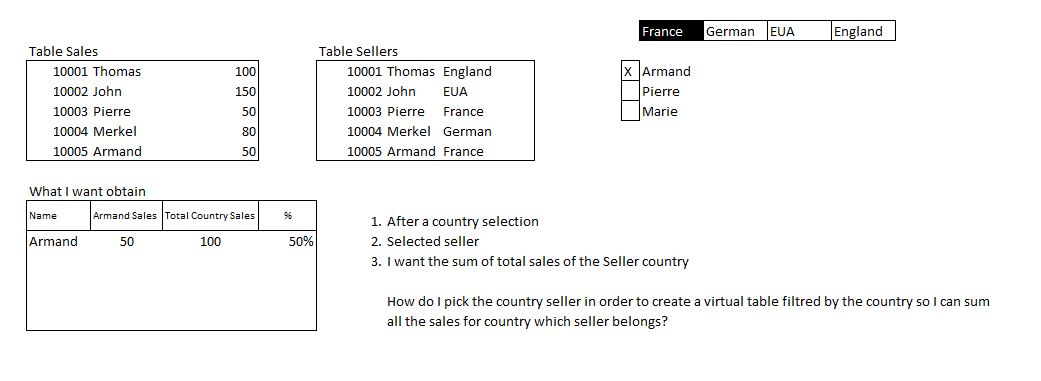
The attachment image shows what I have and what I want to obtain.
What you’re trying to do shouldn’t be that difficult, but it’s impossible to answer this question without seeing your PBIX file since the DAX to calculate the result you want is entirely dependent on the way you’ve built you data model.
If you can please post your PBIX file, I’m sure you’ll get a quick and specific solution to your problem (probably more than one…).
Hi @JoaoMonteiro, we aim to consistently improve the topics being posted on the forum to help you in getting a strong solution faster. While waiting for a response, here are some tips so you can get the most out of the forum and other Enterprise DNA resources.
Use the forum search to discover if your query has been asked before by another member.
When posting a topic with formula make sure that it is correctly formatted to preformated text </>.
Use the proper category that best describes your topic
Provide as much context to a question as possible.
Include demo pbix file, images of the entire scenario you are dealing with, screenshot of the data model, details of how you want to visualize a result, and any other supporting links and details.
Not at all! I still do this exact same thing myself - mentally jump to a much more complex approach than necessary, overlooking a much simpler solution. Sometimes it just takes someone to look at the problem with fresh eyes, which is what the forum is great for.