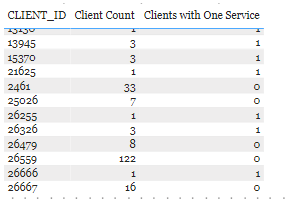
I need to create a table that only shows clients with a frequency of one. I created a calculated column that shows a 1 if the client frequency is 1, and 0 otherwise. Most of the time it returns the correct values, but not always.
Clients with One Service =
VAR clients = CALCULATE( COUNT( ‘Service Table’[CLIENT_ID]), ALLEXCEPT( ‘Service Table’, ‘Service Table’[CLIENT_ID], ‘Service Table’ [APPTYP_ID], ‘Service Table’[VOID_FLAG] ), ALLEXCEPT( ‘Client Table’, ‘Client Table’[REG_DATE] ) )
Hi @RDW, I noticed you didn’t provide a PBIX file. Providing one will help users and experts find a solution to your inquiry faster and better.
A perfect initial question includes all of the following:
A clear explanation of the problem you are experiencing
A mockup of the results you want to achieve
Your current work-in-progress PBIX file
Your underlying data file (to allow us to go into Power Query if necessary to transform your data and/or data model – often DAX questions really end up being data modeling solutions)
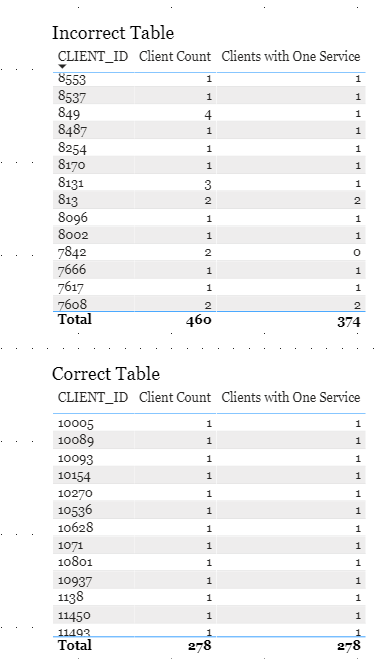
My apologies for not being clear. I need to count the number of clients that appear only once in the table. When the client only appears once, they should have a 1, and a 0 otherwise. The incorrect table has 374 clients and the correct table has 278 clients. I need to use this in measures and tables so a simple filter won’t work. I’ve attached the pbix file.
Not sure if this helps. created a table with summarizecolumns. But while Client count and the calculated onesvc column match, the total is 308, not 278. Likely missing something with the contexts. DNA_Forum_Data-tb.pbix (497.3 KB)
@paidcritc & @ Melissa both solutions work, thank you very much. So I can understand better, would you explain why this has to be done in a table and not a column?
@paidcritic@Melissa the measures that you gave me work perfectly, but still doesn’t get me exactly what I’m looking for. Once the date is added to the table, it returns every single row because the client count for that row is one. What I need is a table that shows the detail for each row, but only includes clients that appear once in the data set. Any ideas on how to accomplish this?
@Melissa I’m going add one more thing to the complexity. Removing filters works perfectly, but I still need to filter out some values from APPTYP_ID. Is there a way to do both?
I’m guessing the current page filter but I can’t be sure without a better description of your actual requirement. Give this a go, or amend to your needs.