Per our conversation, there are some simple things you can do to make that heatmap more attractive. First, though I will say that for someone new to Power BI, there’s a lot to like about what you’ve done with this report. I work with this same dataset every week, and the data you’ve chosen are highly relevant, actionable and well-organized. The heatmap structure is a good choice for visualizing this data. The main problem is that the color scheme is awful, but fixing it is easy.
- understand how colors work – I am not a graphic designer, and there many folks on the forum who can run circles around me re: design, but I’ve learned the basics of color theory and how to get my reports to look decent. I recommend going to the Data Challenge gallery and looking through the entries to get ideas on how to improve your colors and design elements.

This article goes through the fundamentals of color usage, and explains why we find some color combinations, hues, saturation levels etc. attractive versus not:
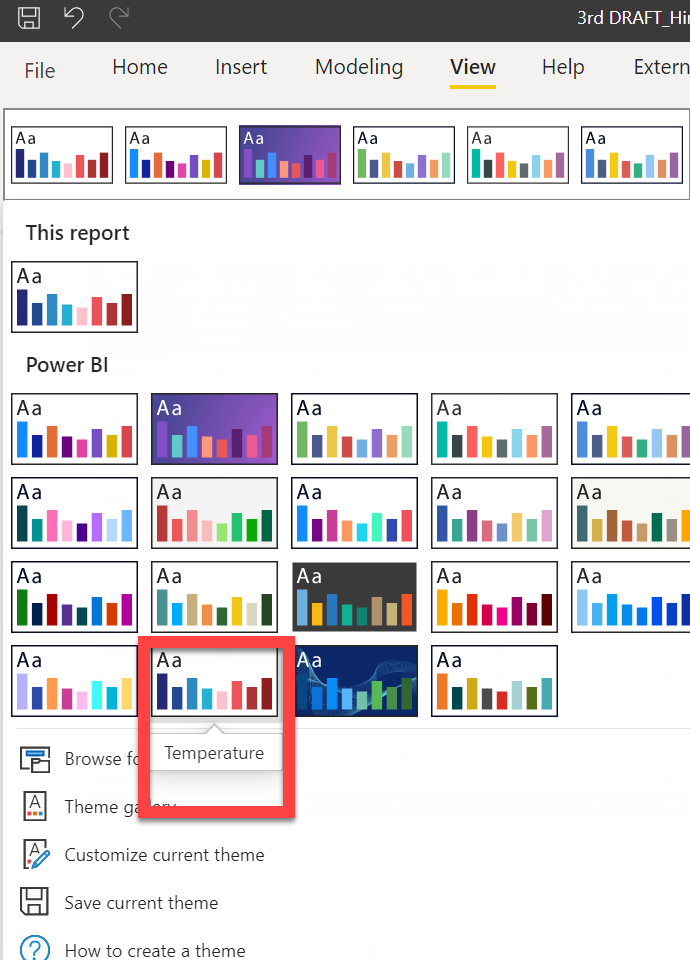
- choose colors that make sense - in the video from @sam.mckay that I referenced above, he always asked the question whether the colors chosen makes sense in the context of the data depicted? In the case of a heatmap, I think it makes the most sense to pick a color palette that goes from “cool” (good) to “hot” (bad). Microsoft, in the built-in themes gallery, has a theme called Temperature that works perfectly for this purpose.
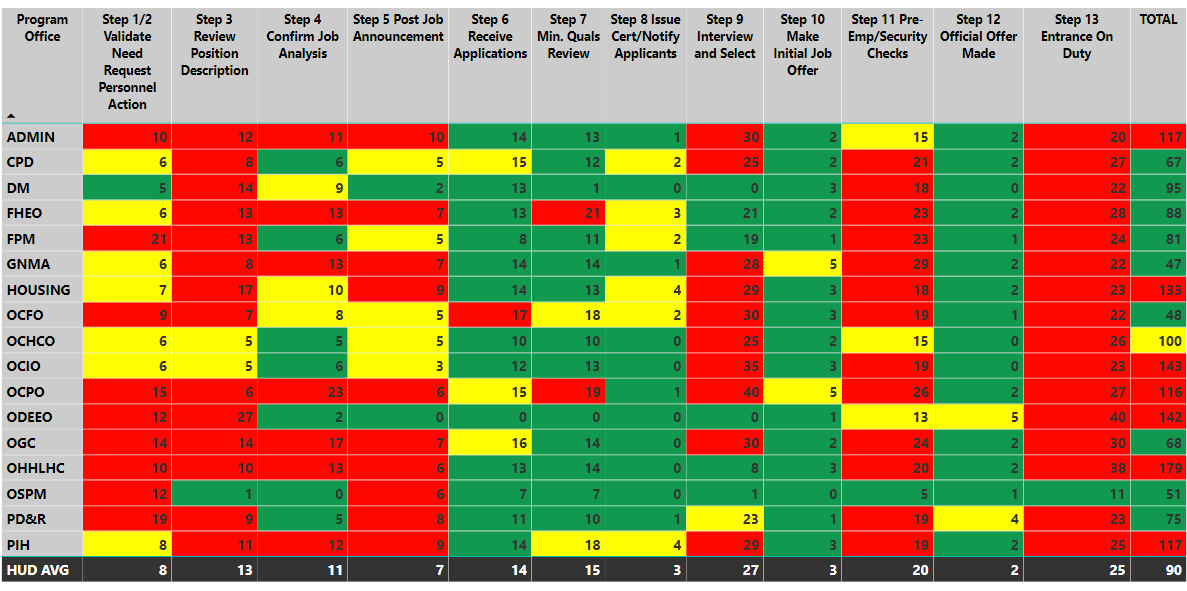
Now with a little work picking complementary colors to make the headers and totals pop, and cleaning up the formatting, we can easily go from this:
To this::
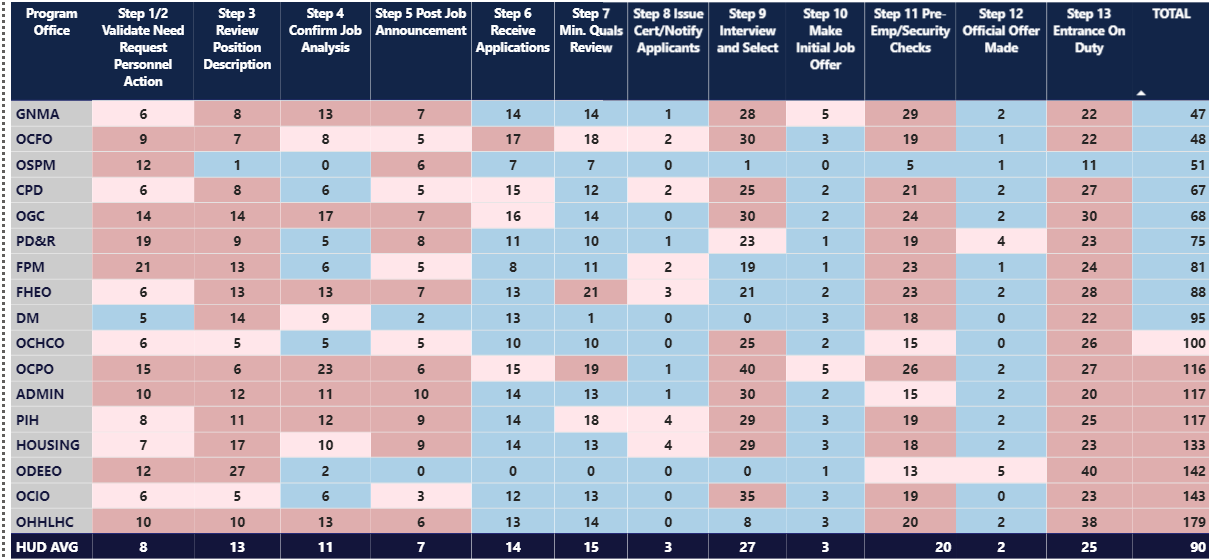
I’m sure the design experts on the forum can do better than that, but I think overall that’s now a pretty good-looking report.
I hope this is helpful. Full solution file attached below.
- Brian
3rd DRAFT_Hiring_TotalHires makeover solution.pbix (757.5 KB)