I think I can help you with all three of these questions:
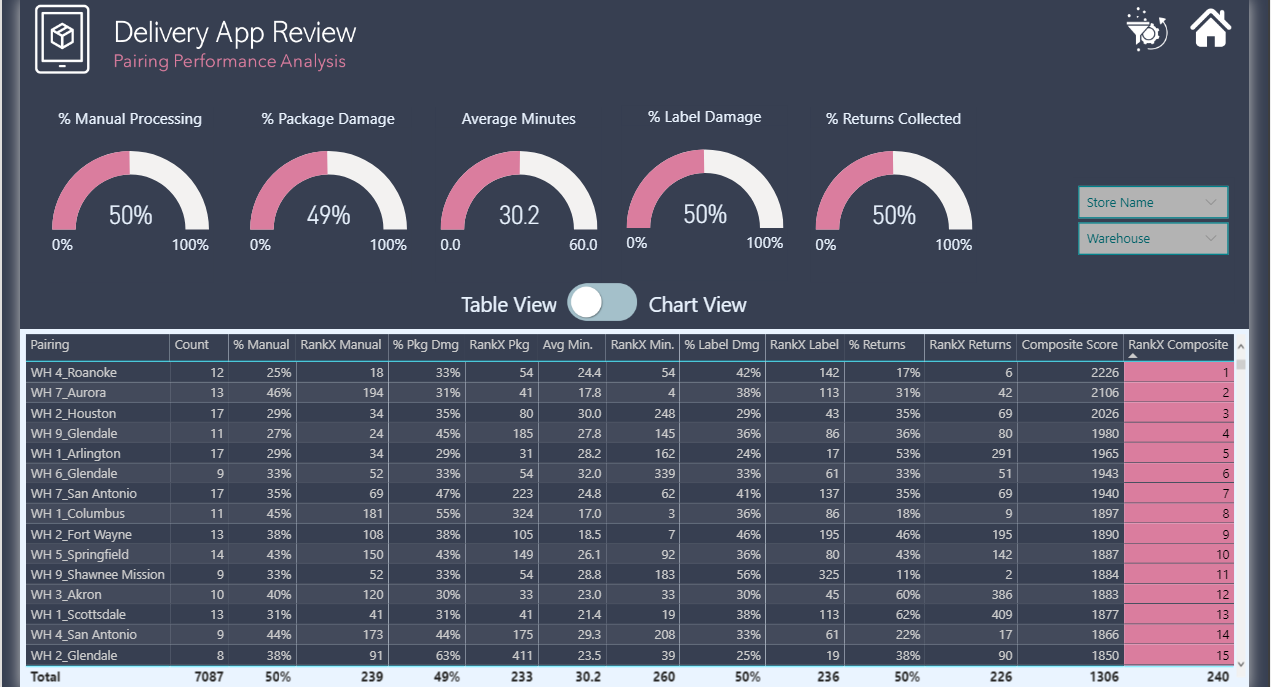
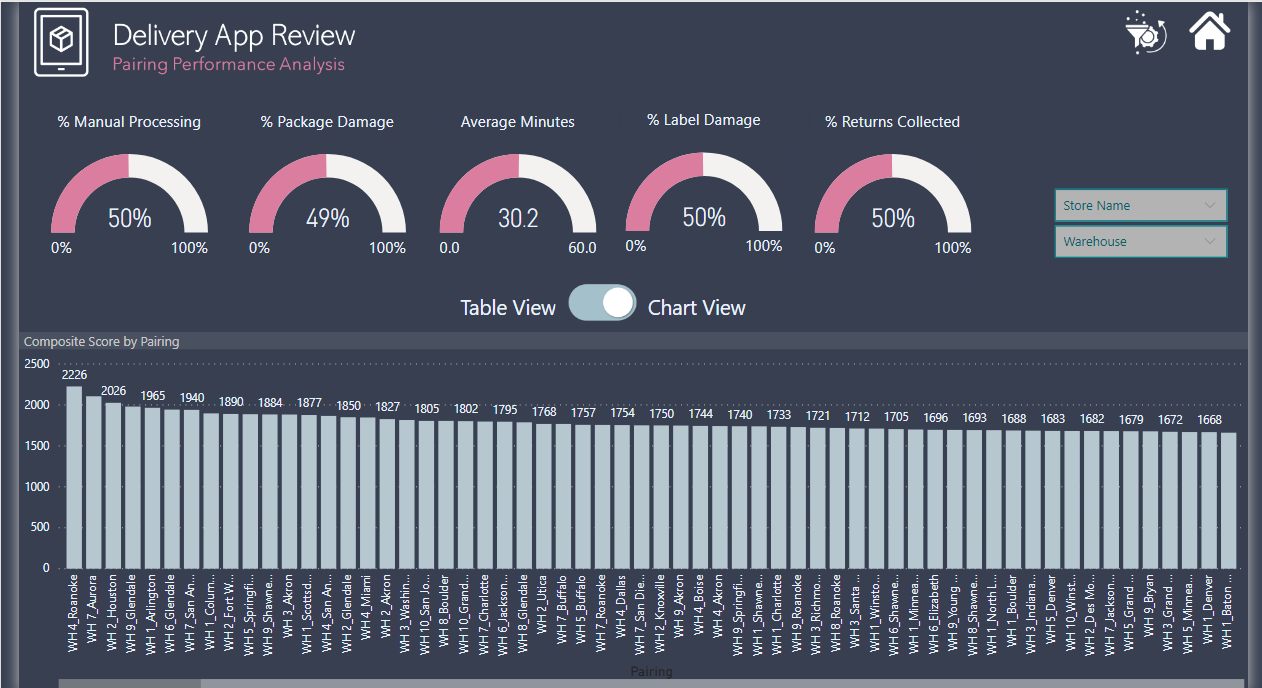
- I would do this with a toggle visual tied to a page navigation button action. Basically, build your page the way you want for the agency goal, then duplicate that page and change the relevant measures, column references, etc. to align with the MOP goal. Have the switch/toggle visual in one position for the first goal and in the opposite position on the second page for the other goal. Then set your page navigation button click to bring you to the other page.
It’s much easier than it sounds - take a look at my Data Challenge #4 entry PBIX file - I used this technique to toggle between the table view and the chart view.
@sam.mckay did a video explaining this technique in detail:

- Custom legend – another great video from Patrick at GIAC on how to do this:

- Building attractive color themes:
I wrote a long post about this earlier this summer, which I think is a good place to start since it references a bunch of excellent resources for color theme generation:
Sam also did an excellent video on this topic earlier this week:

I hope this is helpful. Please let me know if you have any questions about the above.
- Brian
P.S. You and I should talk off-line at some point – it sounds like we do some very similar things within the Federal Government, and I’ve been building a number of reports addressing the same HR/process tracking issues.