Hi everyone,
I am trying to see if it is possible to have conditional formatting of some sort for my monthly columns.
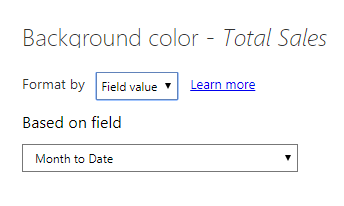
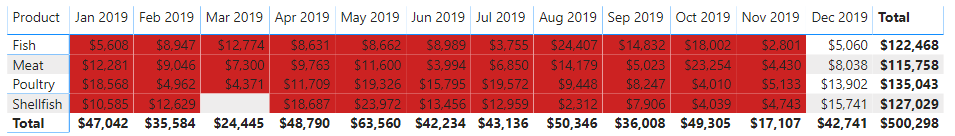
Assume below table as an example. Given that we are in November at the moment, I would like the background or the figures themselves to change colour for all months until November but not the December as it is in the future.
Is there any easy way to get this done?
| Jan.19 | Feb.19 | Mar.19 | Apr.19 | May.19 | Jun.19 | Jul.19 | Aug.19 | Sep.19 | Oct.19 | Nov.19 | Dec.19 | |
|---|---|---|---|---|---|---|---|---|---|---|---|---|
| Product A | 5000 | 6000 | 5500 | 4500 | 8000 | 6500 | 7000 | 6800 | 5000 | 5200 | 8500 | 7000 |
| Product B | 5700 | 6700 | 6200 | 5200 | 8700 | 7200 | 7700 | 7500 | 5700 | 5900 | 9200 | 7700 |
| Product C | 5450 | 6450 | 5950 | 4950 | 8450 | 6950 | 7450 | 7250 | 5450 | 5650 | 8950 | 7450 |