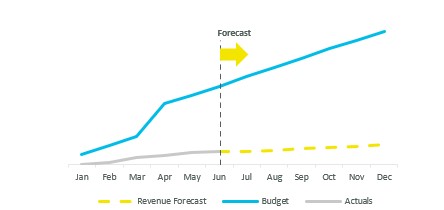
Can we create the attached visual in PBI ?
Also I would like to know, Instance we have 3 values (budget , consumed & variance) which charts are better to showcase these values?
Can we create the attached visual in PBI ?
Also I would like to know, Instance we have 3 values (budget , consumed & variance) which charts are better to showcase these values?