Hello @mbraun,
“Looks like Deferred Income Tax is listed twice as 2 different categories. If this is correct then I am mistaken.” - Well, it’s absolutely correct no doubt in that. The Deferred Income Tax appears twice in the Balance Sheet data. Once under the Assets side and secondly under the Liabilities side.
Being a CA and speaking from the Chartered Accountancy point of view -
When Deferred Income Tax is shown on the Assets side it means that company has paid excess taxes to the government i.e. in other terms you can say - Advance Payment of Taxes and therefore, advances paid are shown on the “Assets” side of the Balance Sheet. For that there’s specific category reserved for it in the Balance Sheet which is also known “Loans and Advances”.
Now, when Deferred Income Tax is shown on the Liabilities side it means that company owes to the government to pay the taxes i.e. Company is liable to pay the Tax amount. For this also, there’s specific category reserved for it in the Balance Sheet which is also known “Deferred Tax Liability”.
In simple terms, when a company book profits higher than the taxable profits, they’ve to pay less now but pay more tax in future. This comes under the Deferred Tax Liability and in the case of reveres scenario it comes under Deferred Income Tax (Assets side).
Well I guess I’ve provided enough explanation on it. Coming to the results part of the Financial Statements -
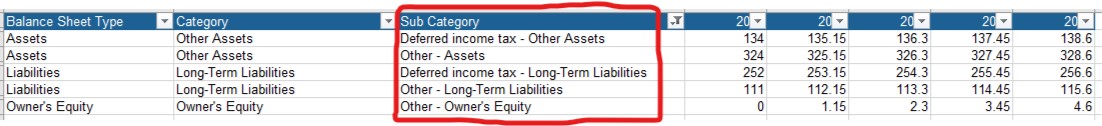
Now, if you’ve observe the data in the Balance Sheet both of them have the same names i.e. “Deferred income tax” but they’re under the different categories with the different amounts for each and every year. Below is the screenshot provided for the reference -
![]()
And the same goes for the “Other” Sub-Category as well. Below is the screenshot provided for the reference -

Now, due to the same naming convention although they’re in the different categories, the formula was not able to identify which “Deferred income tax” or “Other” pertains to which category. Because the conditions specified into the formula is to calculate the sub-totals of each category and then last part of the formula will calculate the total of each individual line items. Below is the screenshot provided for the reference highlighting the part that retrieves the figures of each individual lines items -
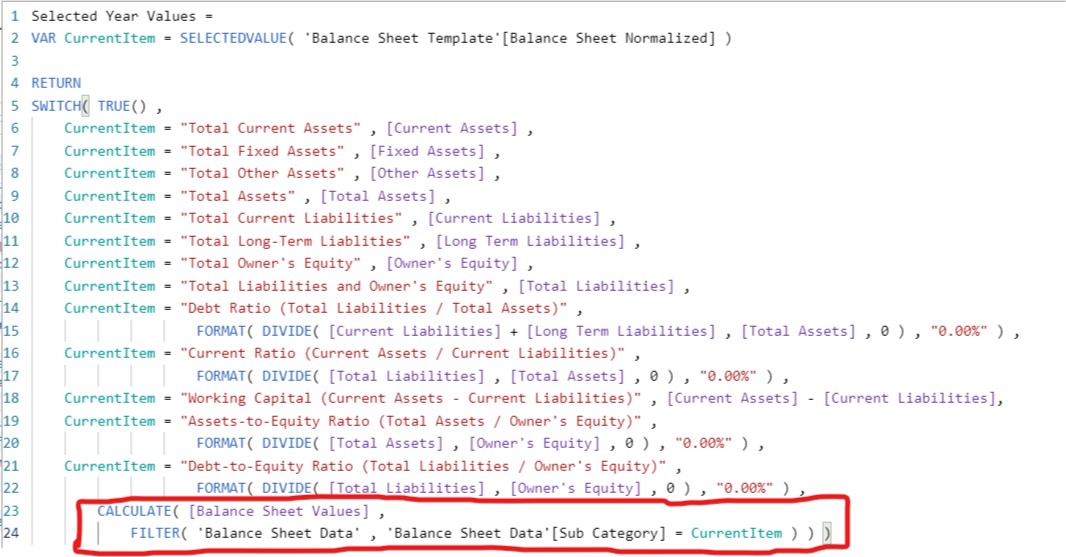
And therefore, inspite of different amounts allocated to them under each category what they did was to sum the amounts and hence the totals for all this sub-categories were same as you’ve highlighted in your screenshot.
Now, once you change the naming conventions in the Excel file of the Balance Sheet data the figures will get back to the normal state. Below is the screenshot provided for the reference about changing the naming conventions -
Also make sure that these same naming conventions also reflect in the Balance Sheet Template otherwise the blanks will be shown into the visualizations.
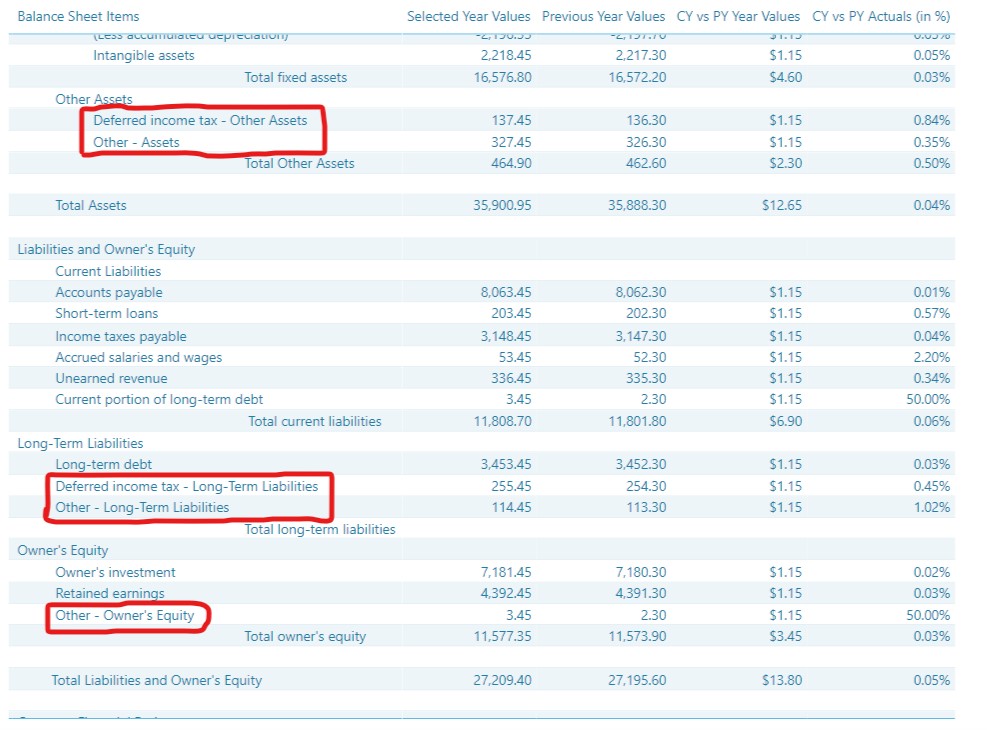
Now, once you change the naming conventions in both the sheets i.e. Balance Sheet Data and Balance Sheet Template. Save the file and go to the Power BI and refresh the file. The figures will be shown as mentioned into the Excel file. Below is the screenshot provided of the final result for the reference -
I’m also attaching the Excel as well as the PBIX file of the working for the reference.
Hoping you find this useful and helps you to achieve the best possible analysis that you’re looking for. 
Thanks and Warm Regards,
Harsh
Financial Reporting In Power BI - Harsh.xlsx (1.1 MB)
Balance Sheet - Harsh.pbix (809.4 KB)