Hello @wwunsch,
Thank You for posting your query onto the Forum.
Firstly, it’s important to attach either the working or demo PBIX file while posting your queries onto the Forum so that members don’t have to create the reference files on their own to provide the assistance.
Since you didn’t attached the PBIX file, in our version we’re referencing the “Total Sales” as a measure/expression rather than “Distinct Count of Stores” (which is currently being referenced in your case) inside the first arguement of the “CALCULATE()” function and then we can discuss about the second part based on which you’ve raised the query.
So, now let’s deep dive into the version of the measures that you’ve written as a filter arguement using the “FILTER()” function.
The first important thing to know about “CALCULATE()” function is, it contains two parameters -
CALCULATE( <<Expression>>, <<Filter>> )
In the first part either we can write a direct expression i.e., the way you’ve written in your case - “Distinct Count of Stores” or we can reference a measure using the measure branching technique. Whilst, in the second part, we need to define the conditions as a filter based on which we want to evaluate the results and by default, “CALCULATE()” function has the implicit filter as an arguement in the second parameter. So, in your both cases, firstly there wasn’t any need to use the “FILTER()” function while defining the conditions. The reason being is, “FILTER()” function works an iterator i.e., it scans each and every row of the column or the table based on the way conditions are defined and then filters out the results accordingly.
Let’s see the pattern of the version 1 of the code that you’ve written -
Total Sales v1 =
CALCULATE( [Total Sales] ,
    FILTER( Sales ,
        Sales[Product Description Index] = 1 ) )
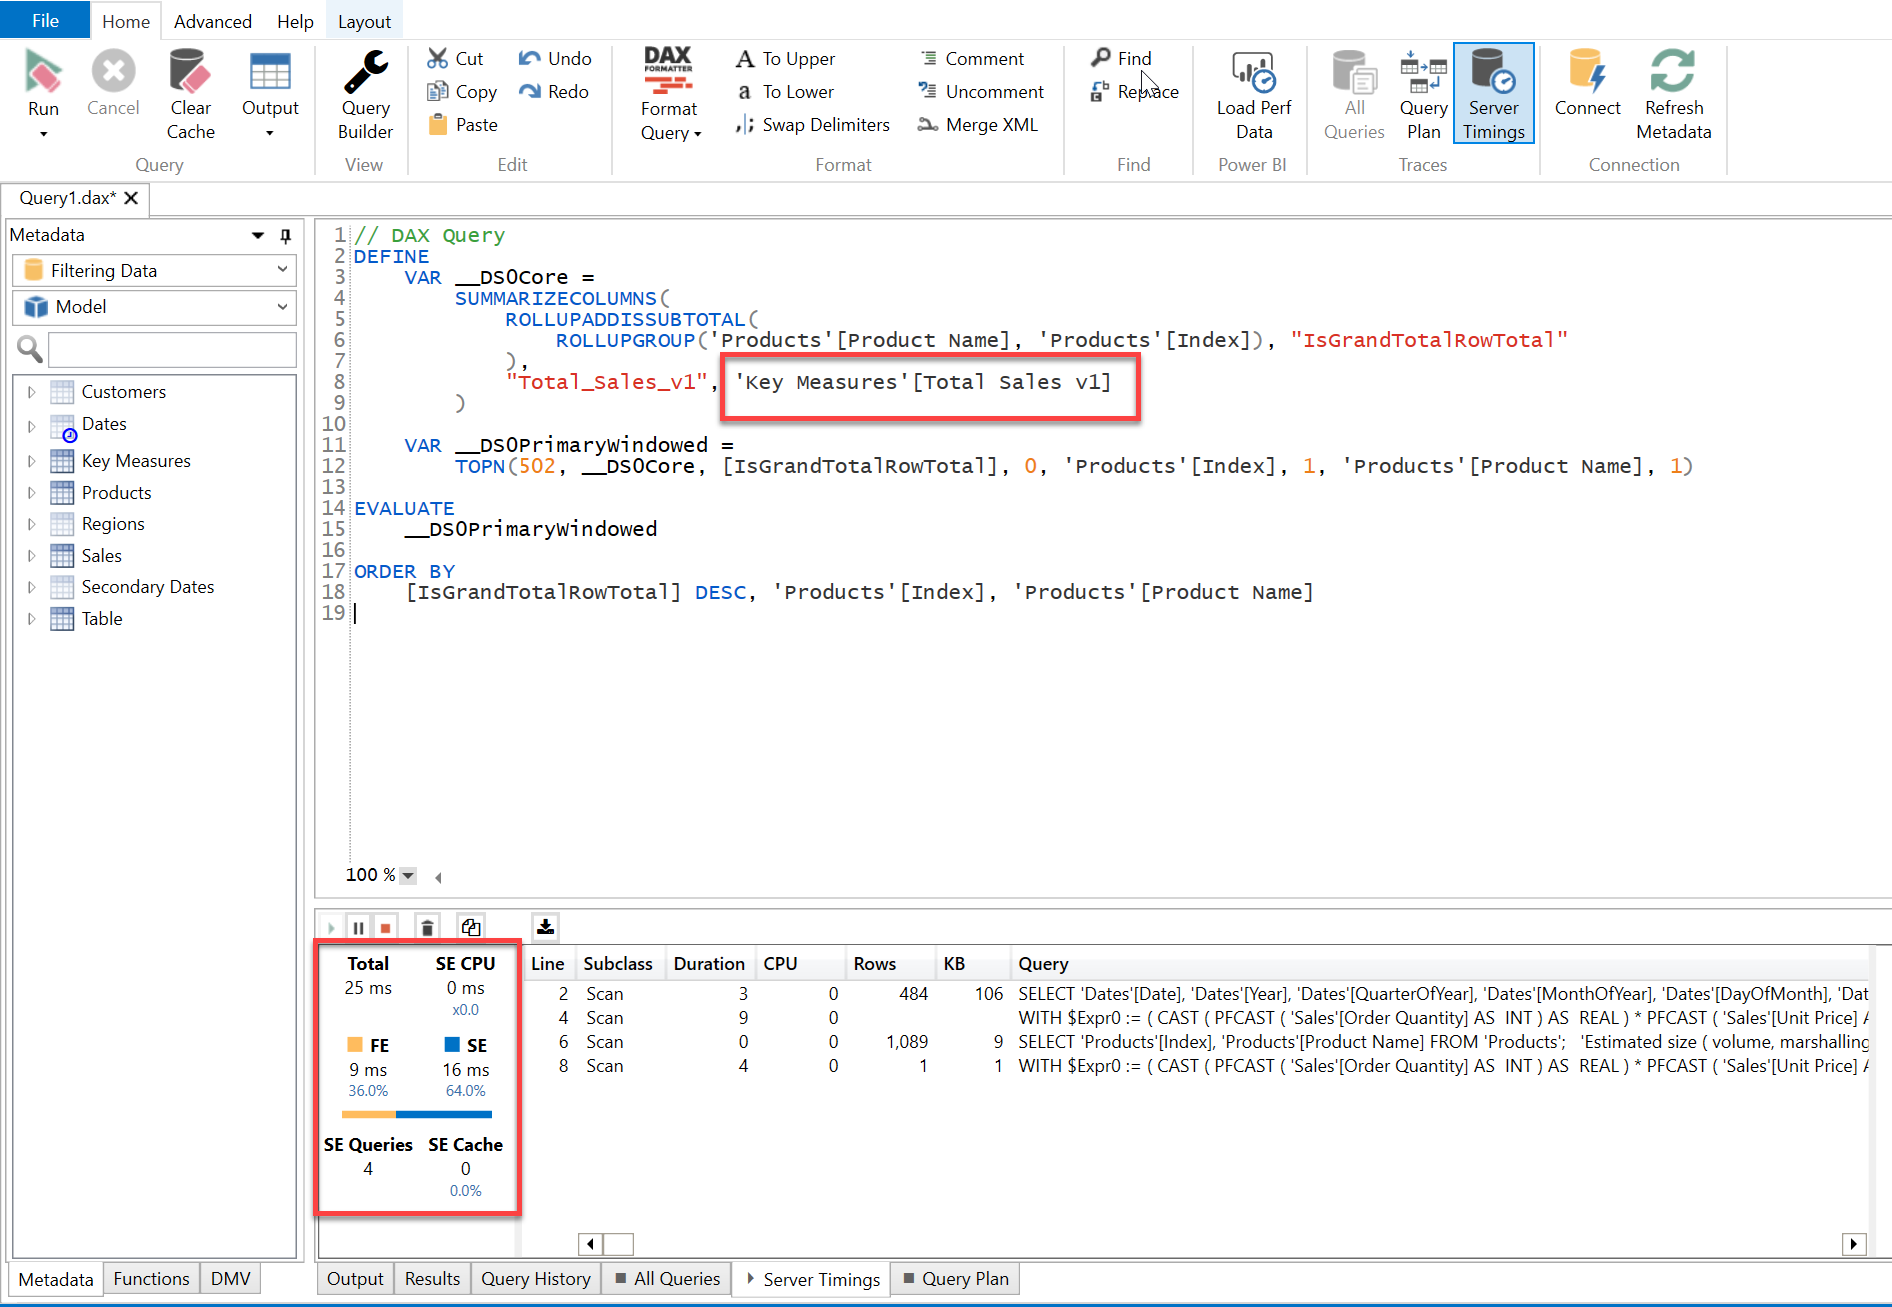
In this pattern, you’re referencing the entire “Sales” table which is a Fact Table and then filtering out the results where Product ID = 1. So, in this case, entire Sales i.e., Fact Table is being iterated first and then all the records with all the columns in that table where Sales[Product Description Index] = 1 is being retained. Here’s how Power BI evaluates the operation at the back-end of the engine (refer the screenshot attched below) -
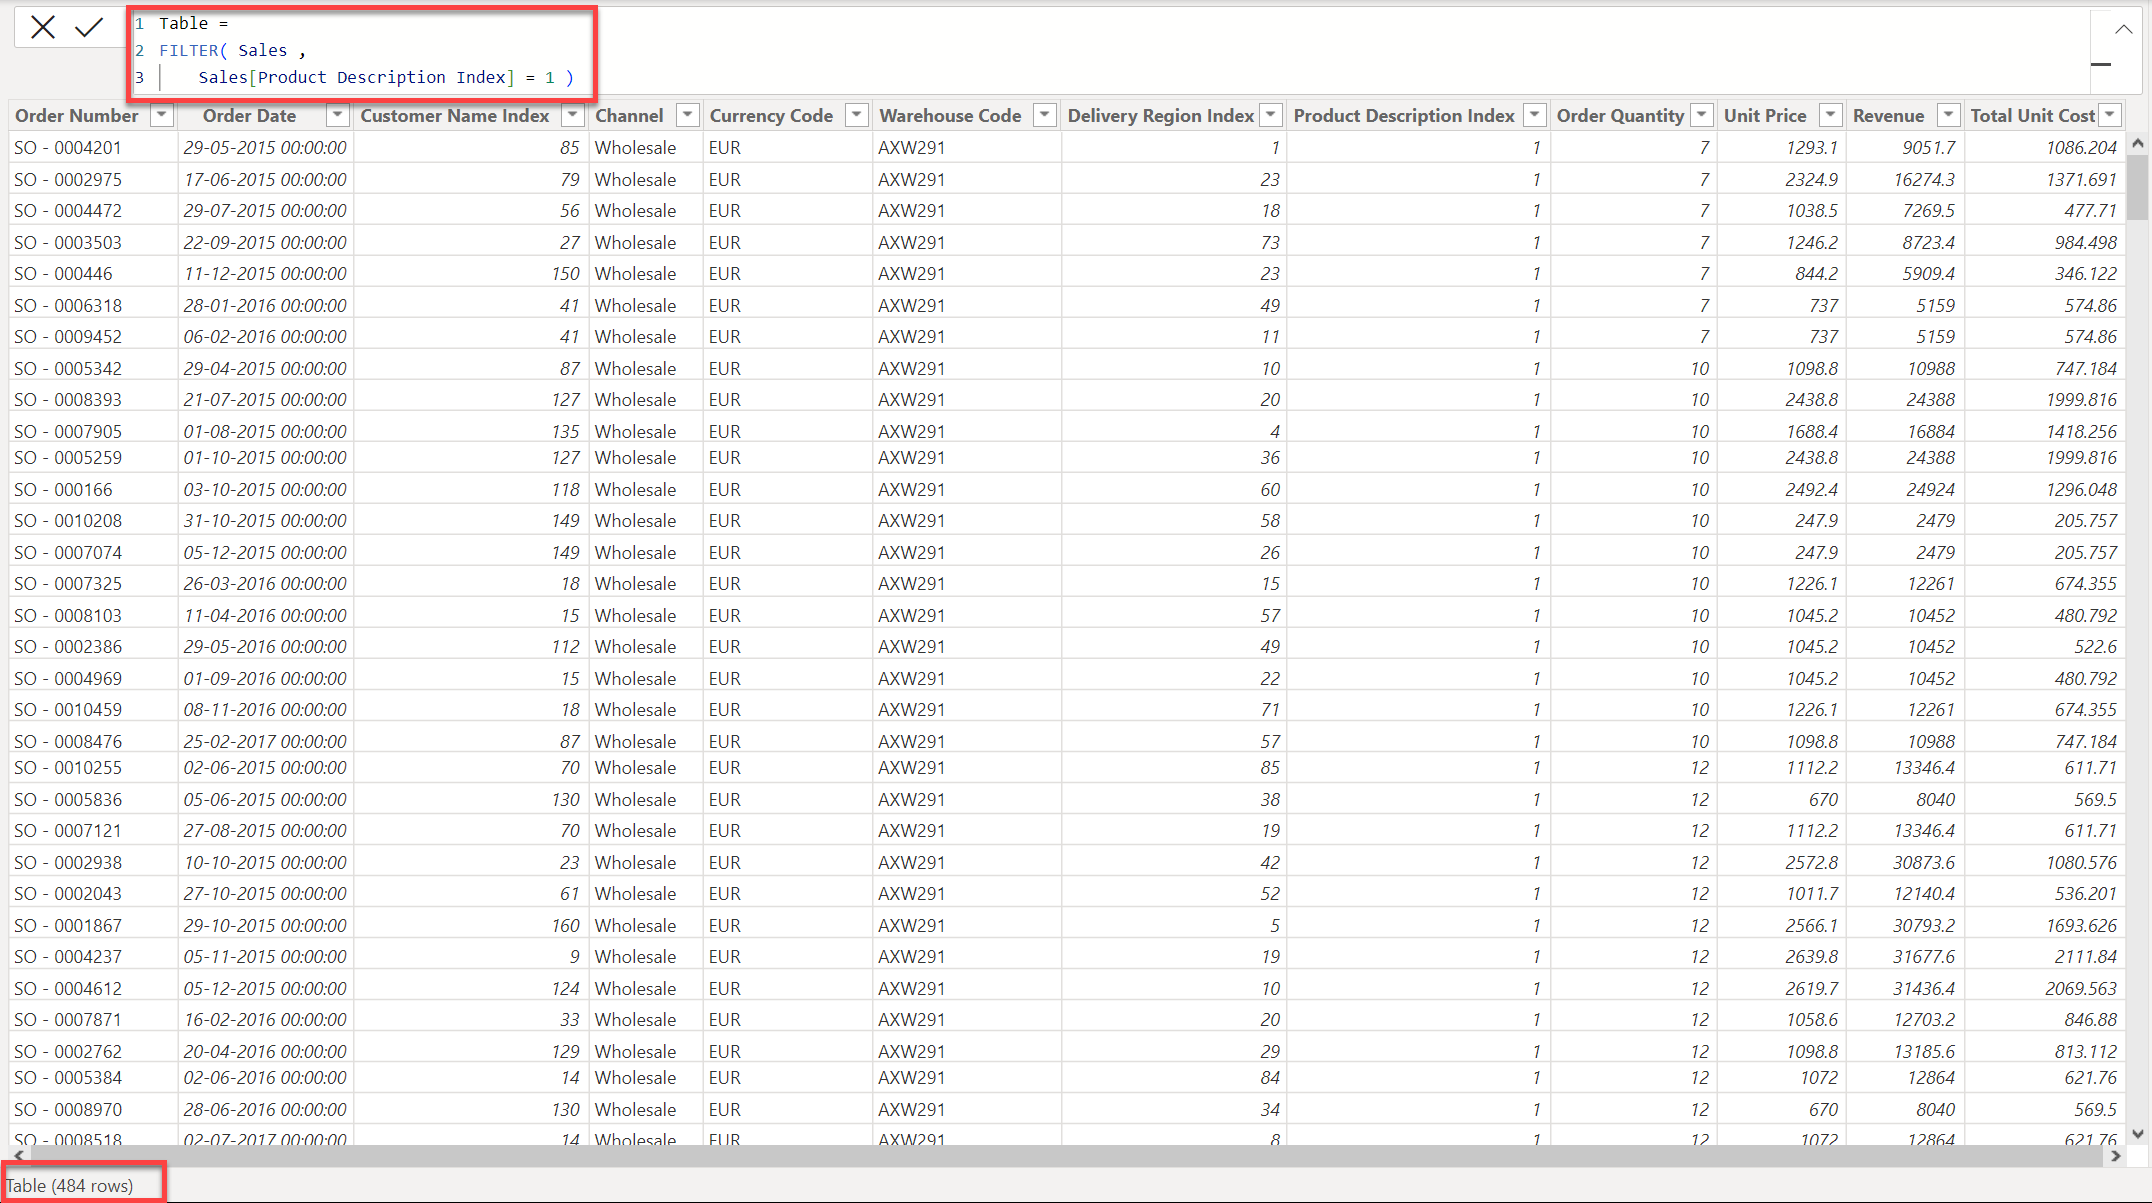
If you observe the above screenshot, since entire Sales table is being referenced inside the “FILTER()” function, it iterates through the entire Fact table (which is by the way 10,685 rows, in my case) at the back-end of the engine and then retrieves all the records and columns consisting of 484 rows which is a very heavy operation because everytime to evaluate the results, it has to scan all the records of the entire Fact table and therefore, slows down the calculation.
Now, let’s see the pattern of the version 2 of the code that you’ve written -
Total Sales v2 =
CALCULATE( [Total Sales] ,
    FILTER( Products ,
        Products[Index] = 1 ) )
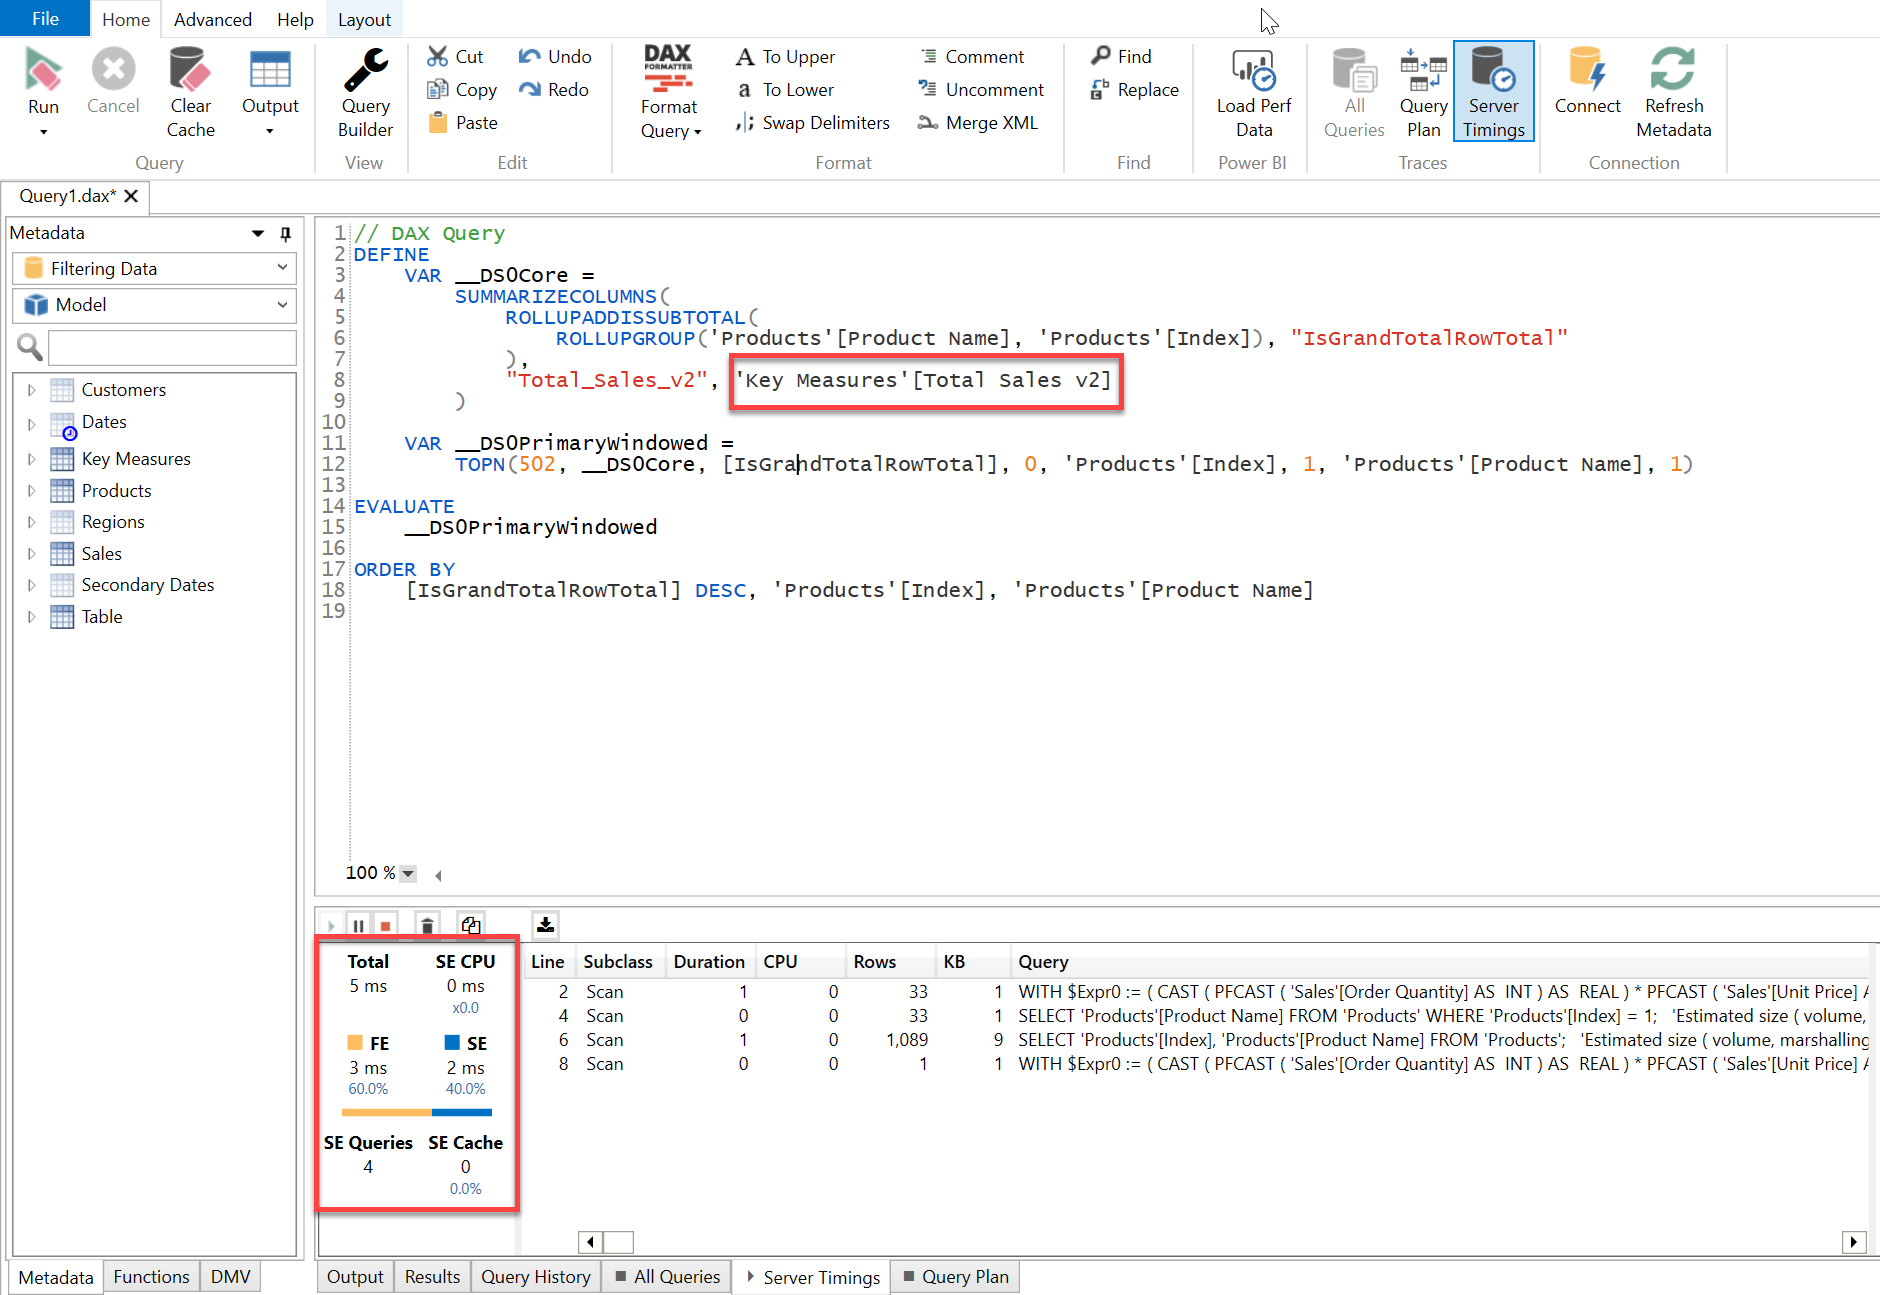
In this pattern, you’re referencing the entire “Products” table which is a Dimension Table and then filtering out the results where Product ID = 1. So, in this case, entire dimension table is being iterated first and then where Products[Index] = 1 only that specific row is being fetched and then results are evaluated accordingly. Here’s how Power BI evaluates the operation at the back-end of the engine (refer the screenshot attched below) -
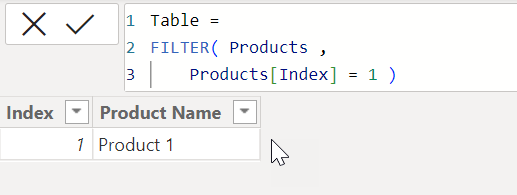
If you observe the above screenshot, after the iteration over the entire Dimension Table i.e., Products table (which is by the way 30 rows, in my case), it only has to fetch one unique row from the table where Products[Index] = 1.
Now, if you compare the results in terms of visualizations they will still render the same figures. But if you compare the timings in terms of operations to evaluate those same results then you’ll see the difference. Below is the screenshot provided -
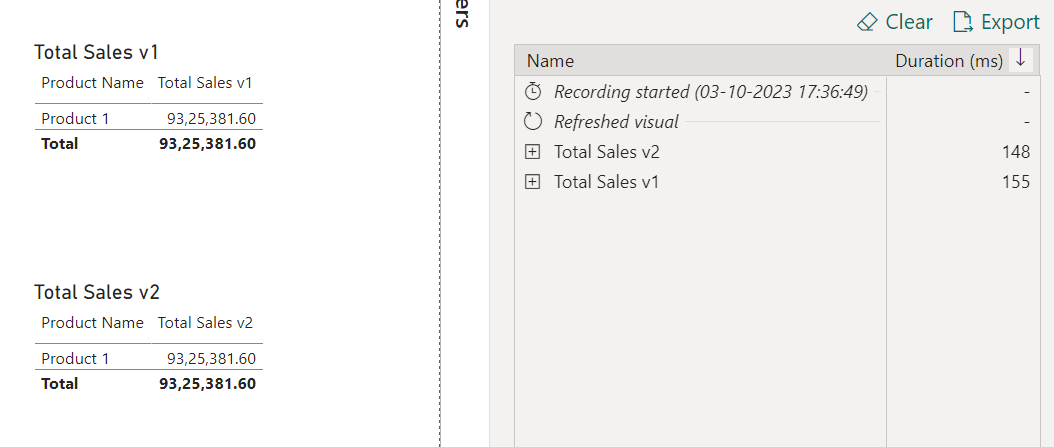
As you can see in the above screenshot, although the results showcased in both the table visualizations are same but in terms of operation to evaluate the results, version 2 of the code performs a faster than the version 1 since version 2 iterates through over the entire Dimension Table which is unique in nature and smaller in size whilst version 1 has to scan over the entire Fact Table.
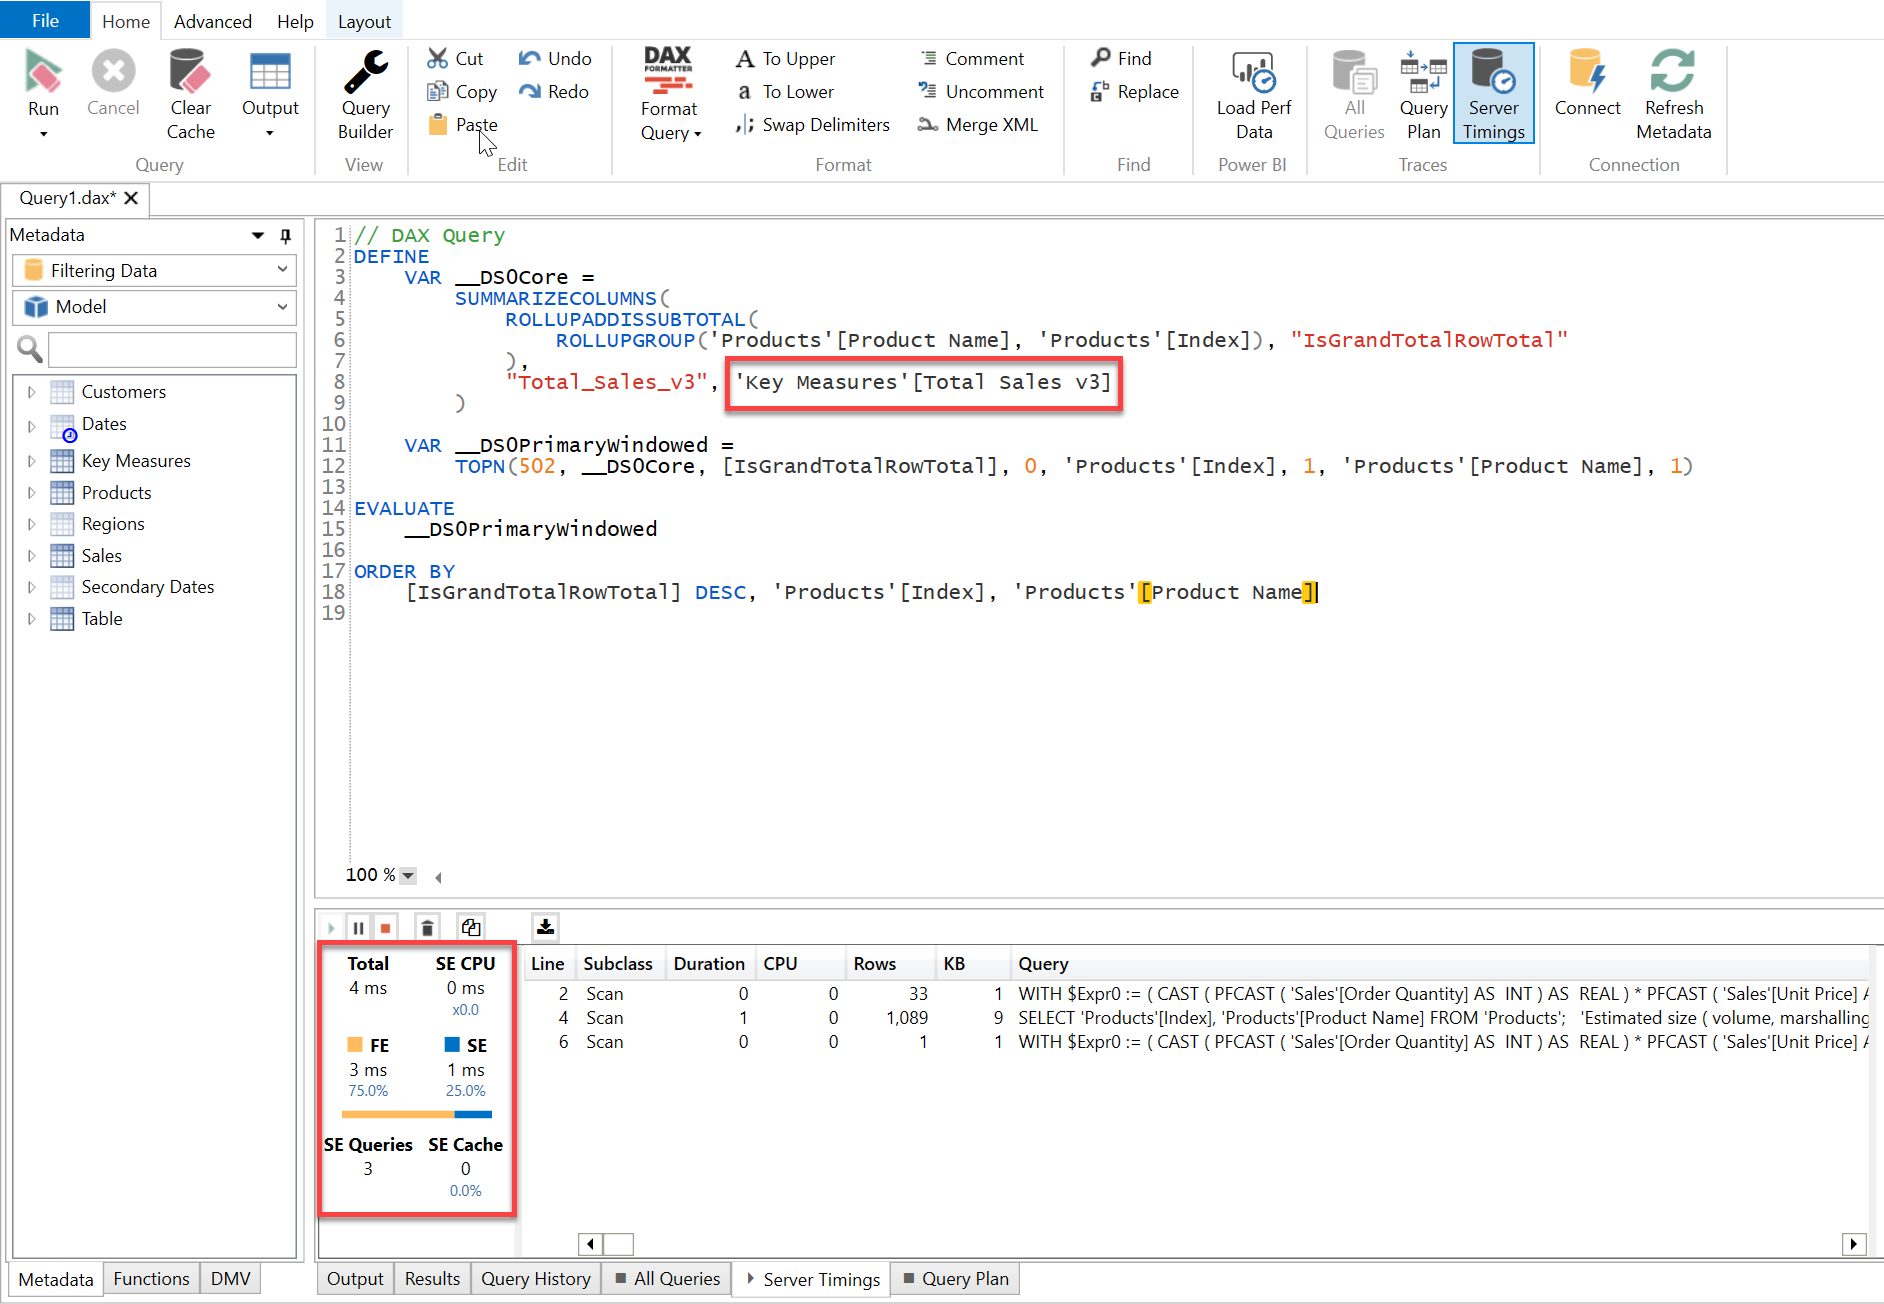
Moreover, as I had suggested earlier that, “CALCULATE()” function contains the second arguement as a filter implicitly and therefore, there was no need to use the “FILTER()” function in this case. You could have simply written the code like this to evaluate the exact same results -
Total Sales v3 =
CALCULATE( [Total Sales] ,
    Products[Index] = 1 )
Now, when a code is written like the one provided above. Power BI translates the given code internally to this (which are one and the same) -
Total Sales v3 =
CALCULATE( [Total Sales] ,
    FILTER( ALL( Products[Index] ) ,
        Products[Index] = 1 ) )
Thereby, applying FILTER() internally at the back-end of the formula engine.
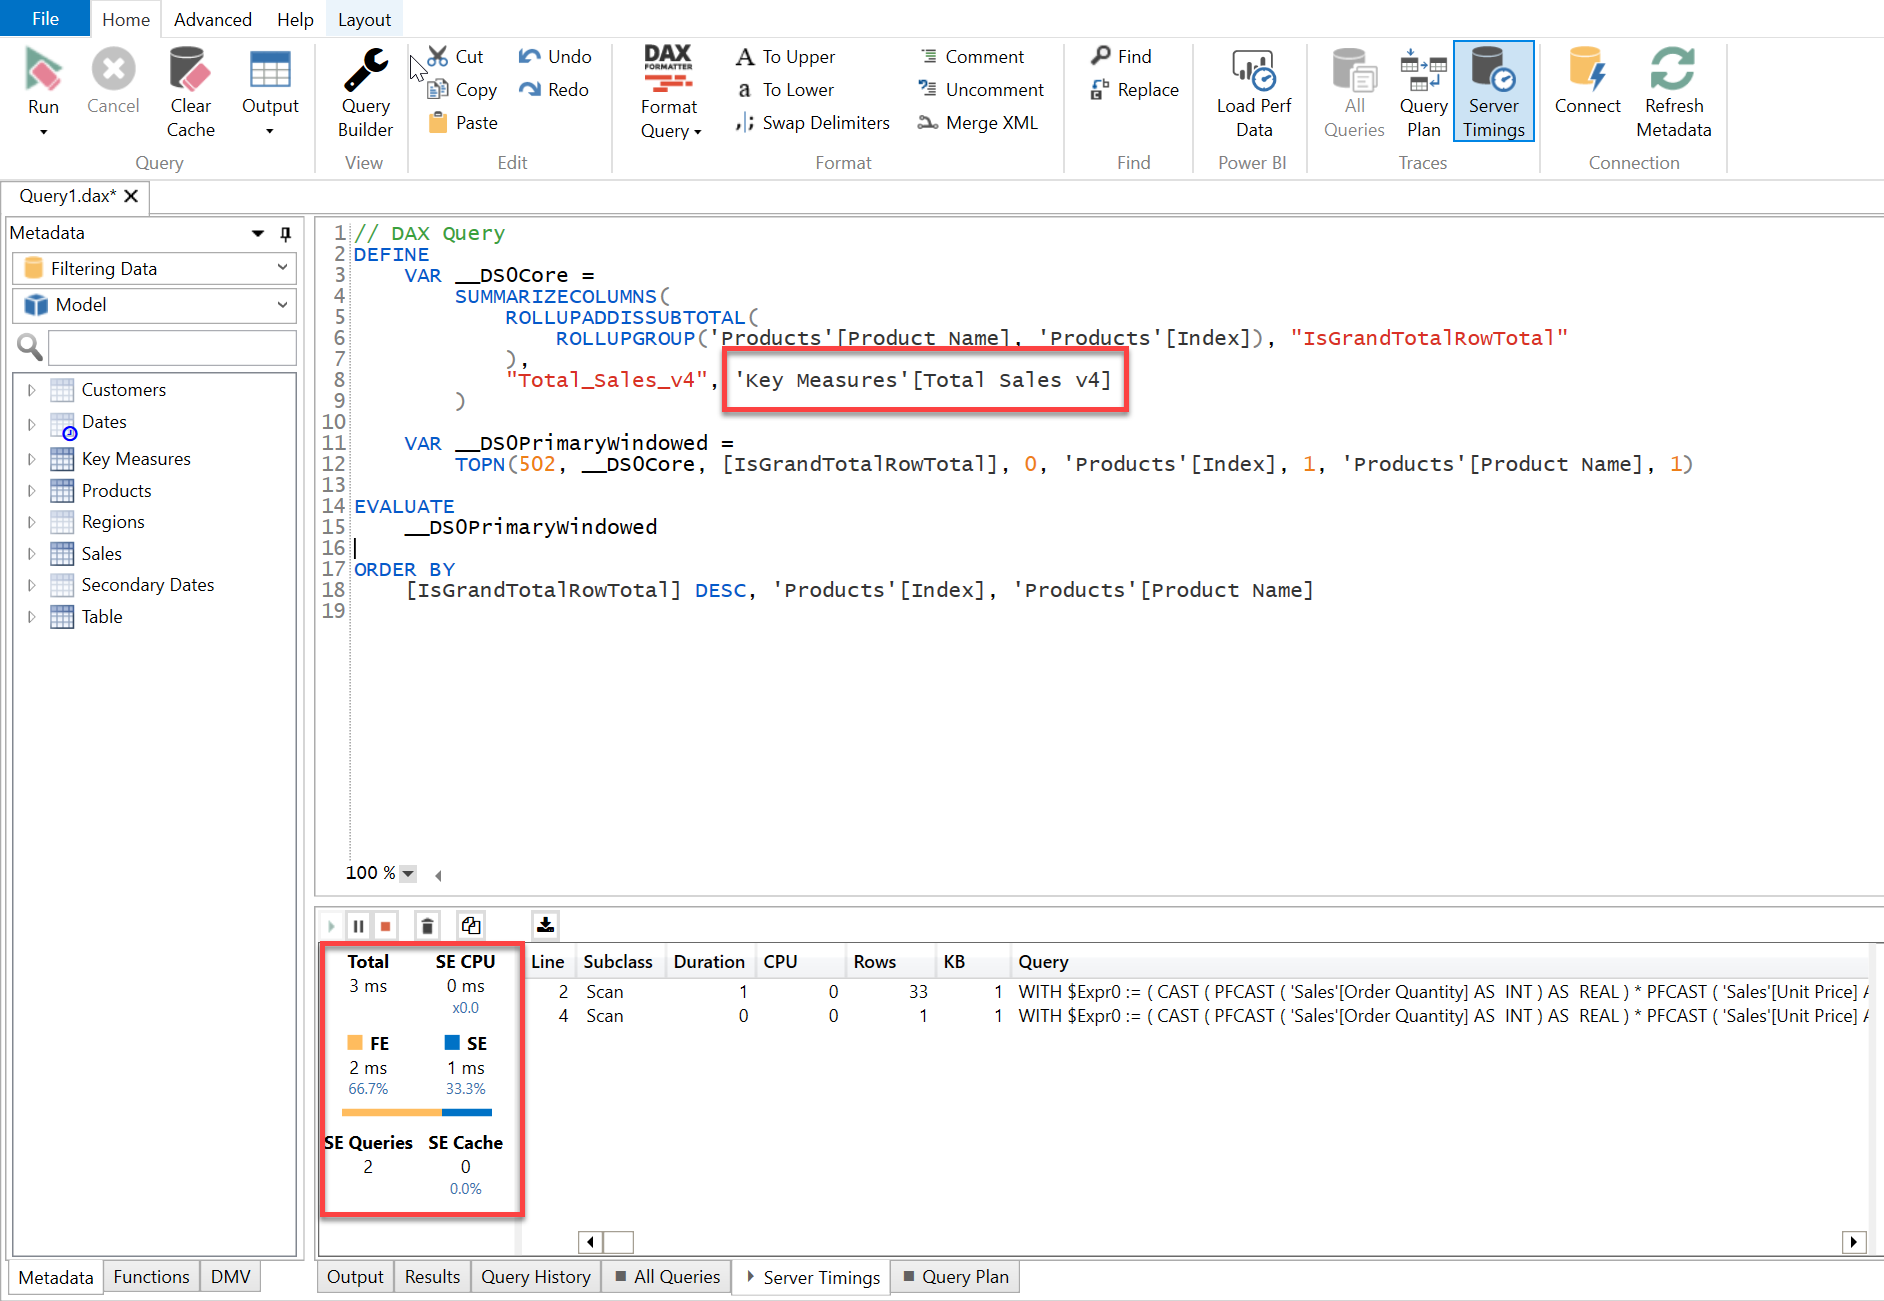
And lastly, from optimization perspective, if a code/measure would’ve been written like this -
Total Sales v4 =
CALCULATE( [Total Sales] ,
    KEEPFILTERS( Products[Index] = 1 ) )
Then this measure is the fastest in terms of operation to evaluate the results.
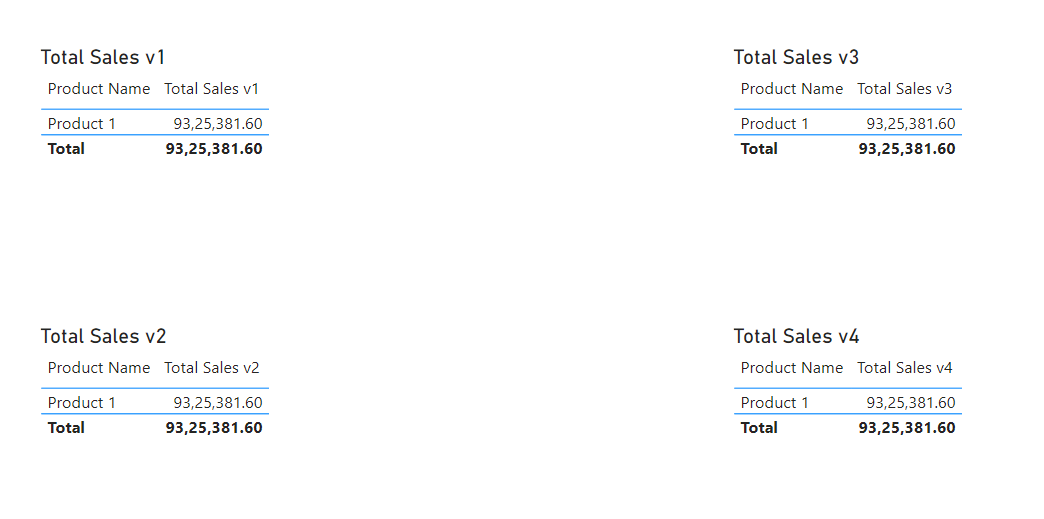
In order to check the performance of these 4 visuals, copy the “DAX Query” one-by-one from the Performance Analyzer of each visual, paste it in the DAX Studio and enable the “Server Timings” option and then run the query one-by-one to see their performance.
Below are the screenshots provided for the reference purposes -
I’m providing few of the links below of the articles as well as of videos based on your query that you’ve asked for your reference purposes. Also, you can go through the Enterprise DNA education learning portal to learn about the fundamentals of DAX more in-depth.
Hoping you find this useful and helps you in your learning curve.
Thanks and Warm Regards,
Harsh
