I am trying to replicate a excel “index/match/match” feature on my powerbi dasbboard. Specifically, I have a database of over 5mm customers, I would like to have a search box feature on my dashboard were the user can type in the customers name and it can pull up their associated information from related fields such as:
Name
Address
Total Sales
Can anyone advise on how to create this on a powerbi dashboard?
There is no need for logic like excels “index/match/match” to filter a table.
That filtering takes place automatically by context you provide the underlying Model.
For example, here’s a small model
As you can see I don’t have any additional Customer details so I’ll illustrate the principle with a field from the Date table instead.
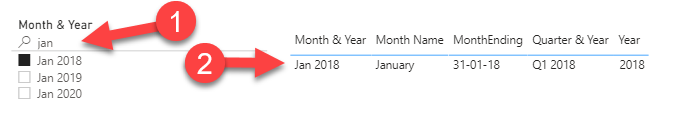
I’ve added a Slicer to the Report page and enables the “Search” field (1)
Entered a text “jan”
And Selected one Value “Jan 2018”
This filters the Model and in the table details on the selection are visible (2)
Please review the Data modelling- and Ultimate Beginners Guide courses in the Portal.
Need to start to think in a database structure like style. That mean divide the elementary data into different tables:
Fact : hold the numeric values on which you will perform the analysis/aggregation (sum, count, etc…); and
Dimension : are the attributes used for cut and slice the analysis performed on the Facts.
In excel when you have a fact in a table and want to add extra attributes (dimensions) for your pivot tables/analysis, will start using lookups (vlookup, hlookup, match/index) to import the required attribute to end up with a flat table.
Well approaching the database structure, but bear in mind the structure in Power BI may be simpler than a database one, you have your fact table that are refereeing to the dimension table by a link.
Link from the dimension to the fact table where one occurrence of the attribute is in the dimension table and may be multiple in the fact.
To make the visualization of the concept easier, when structuring your database model put the dimension on top and the fact below.
Facts can be cross sliced if the table is linked to the relevant dimension.
In the databases theory the reference between the dimension and fact table for each dimension is a dimension ID that better to be numeric format (integer).
I dont think I was articulate in my request as well as I could have. I would like to have a field on the dashboard where a user can type in the company name and it would pull up certain information such as total sales, geo location, ethnicity, etc.
The fact table consists of over 5mm rows. While it is good to see some aggregated visuals, I also want to give the user the option to type in the name of as specific company and it pull the data they are looking for (a few predetermined corresponding columns). In excel I would have done this with a xlookup, where the user could type in the company name and all the corresponding info appear. I am looking to pull in this same feature into a dashboard.
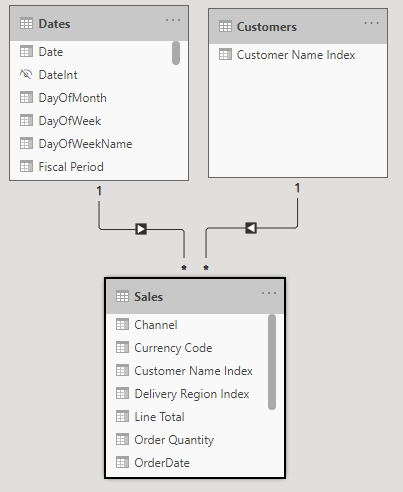
Here is my backend data model for your consideration:
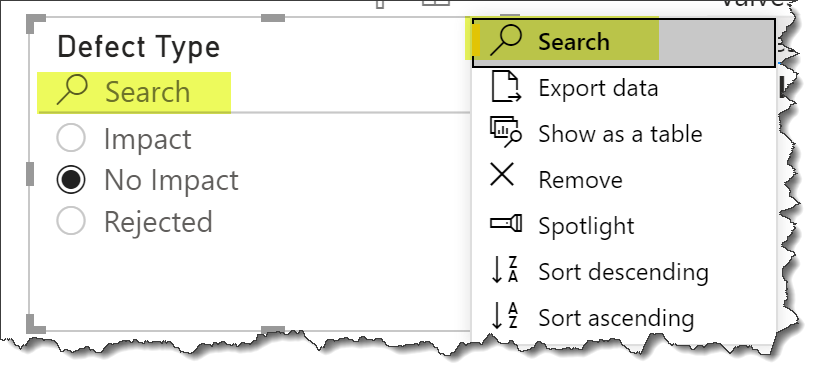
Hi @pjones. AFAIK you can’t do this in PBI at the moment (hopefully another forum member will prove me wrong). What you can do, however, is to enable search on your slicer dropdown
and allow your users to enter the first few letters of interest, then select from the available items (apologies on the poor example, but I’m slammed for time at the moment).
Hope this helps.
Greg