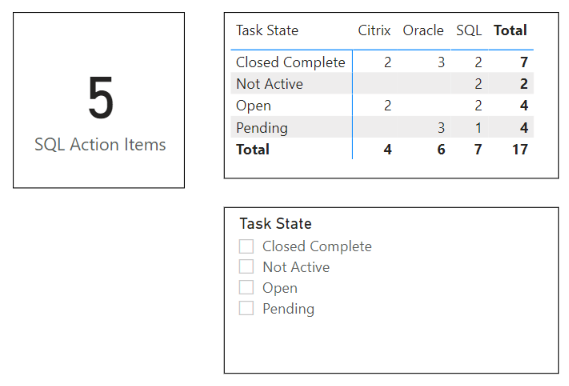
I’ve got a Measure created where I’m filtering in the measure using <>
It seems when I create a measure using that logic it can’t be filtered by any other table. I’m sure there is some logic there that I don’t understand.
I’ve attached the PBX and Excel file.
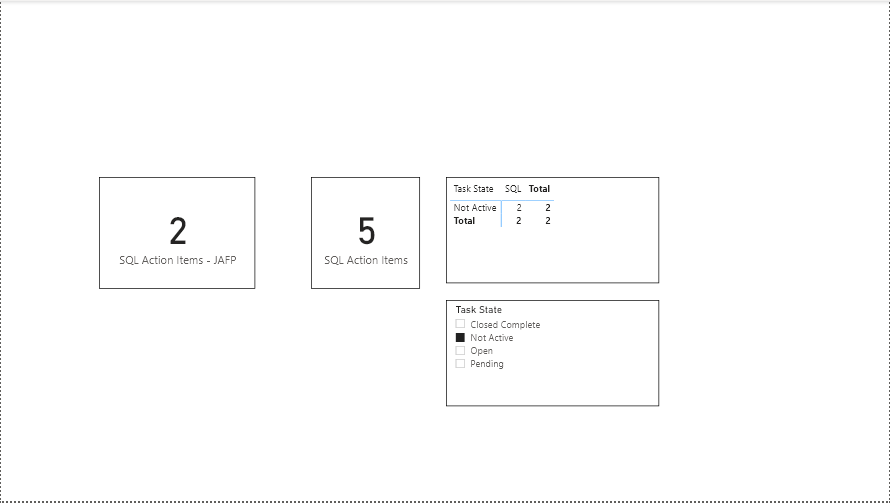
I would like the card to update when i click on the Task State.
eDNA Measure Understanding.pbix (21.2 KB)
Source Data Measures.xlsx (17.1 KB)
1 Like
Hello @chad.sharpe ,
Thank you very much for posting your query in the forum. I’m going to check your example file and see if I can help you.
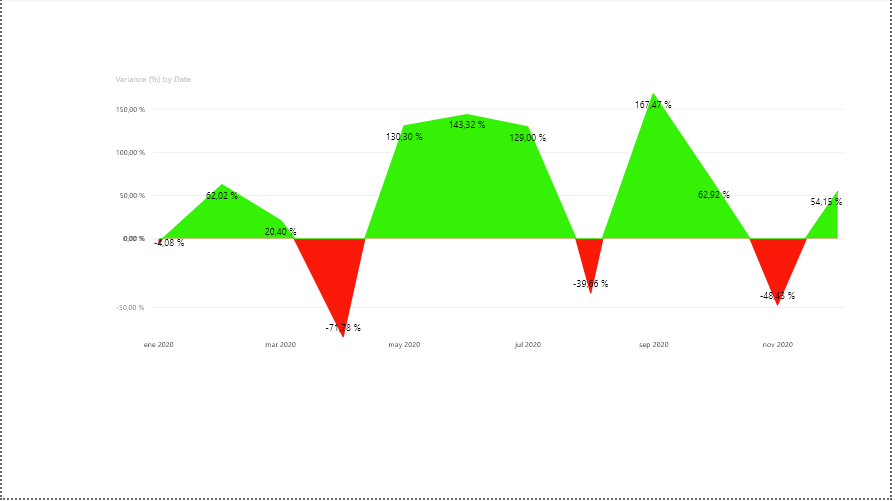
By the way, have you been able to see the solution I shared for the area chart with two colors?
Regards,
Hi @chad.sharpe,
You can modify the measure as follows:
SQL Action Items - JAFP =
CALCULATE(
   'Test File'[Total Tasks],
   'TestFile'[DataSource] = "SQL",
    KEEPFILTERS( 'Test File'[Task State] <> "Closed Complete" )
)
While CALCULATE filters replace the current context, KEEPFILTERS adds filters to the current context.
Regards,
eDNA Measure Understanding_JAFP.pbix (22.7 KB)
1 Like
Thanks,
I also got it to work with adding a “Filter” measure. I guess that works similar to keep filter.
I did review your last post and i liked the effort to add the color but I was hoping to have both the area and numbers aligned with the correct color. Although I really wanted that area chart i decided to move on from it because i couldn’t get it to align just as i needed
Hello @chad.sharpe,
I’m glad you were able to solve it.
When you say you need to align the values and color of the area, do you mean this image?
Regards,
By align I mean i also wanted the data labels to align by color along with the graph.