I have the following requirement for one of my report.
There is a date filter based on a date table in the filter panel,
There is a relationship based on the Date Table [Date] and “Table”[Date T]
The user want to be able to select a date from the panel and the table must return the transactions with Date T<= Selected Date and Date 2 >= Selected Date.
My Tab “Expected result” shows what I expect to find if I select Oct 3rd in my filter panel.
Eventually, I can slightly modify my report and put the DateTable[Date] field as a slicer in my canvas.
I have been working for a couple of days now without finding a satisfying option. So if anyone could help me find “the” solution it would be greatly appreciated.
I’m still unclear of what you’re expecting. I do see the “Expected result” page now, but unfortunately it just contains the same text as your post. Please prepare a screenshot mockup (in Excel?) of what you are expecting to assist the forum members in their investigations.
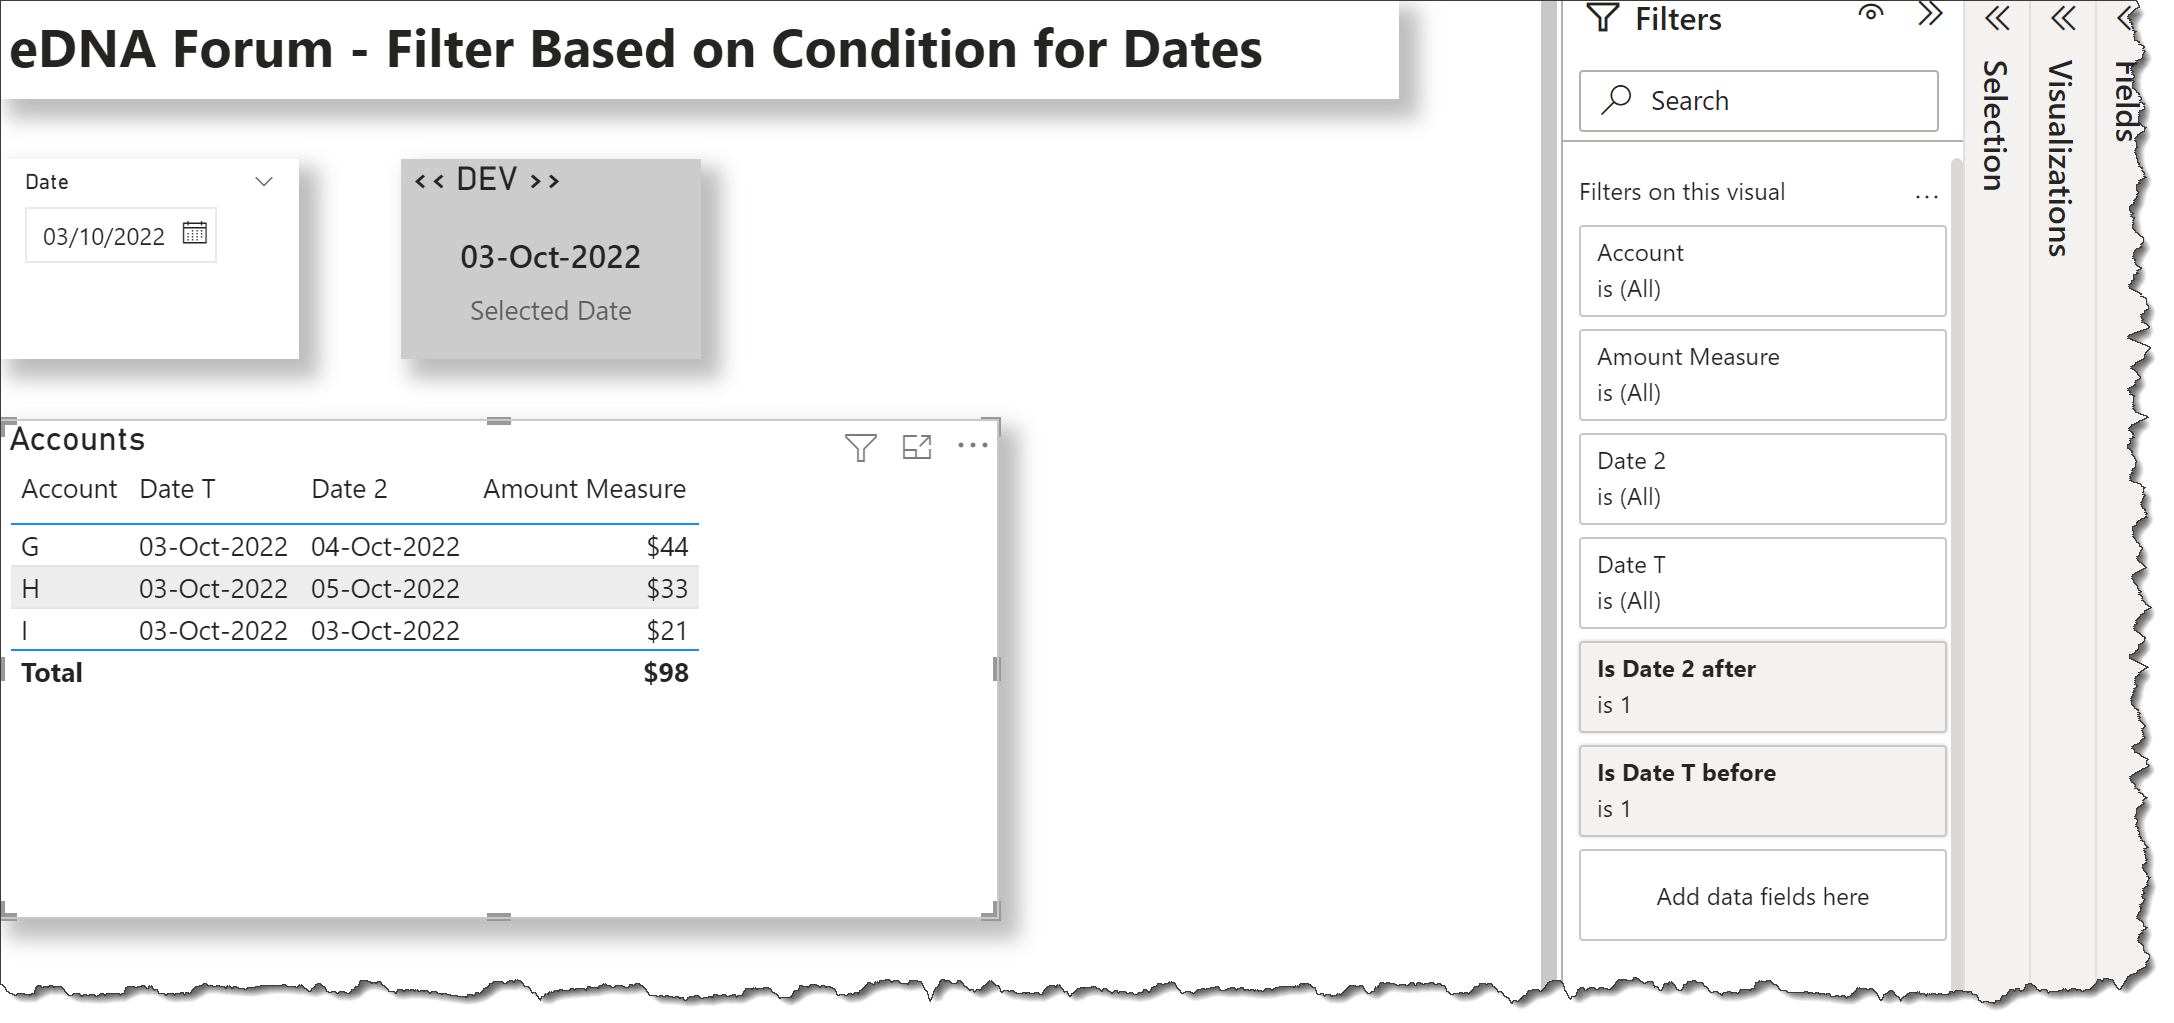
As illustrated if I select October 3rd in my filter pane, I would like my table to automatically display transactions with a Date T inferior or equal to the selected date (Oct 3rd) and with a Date 2 superior or equal to the selected date.
I’ve applied manual filters to the table for the moment just to show what my expected result is but would the goal is to find a dax formula instead of having to deal with filters on the visual.
Due to inactivity, a response on this post has been tagged as “Solution”. If you have a follow question or concern related to this topic, please remove the Solution tag first by clicking the three dots beside Reply and then untick the check box.