Hello
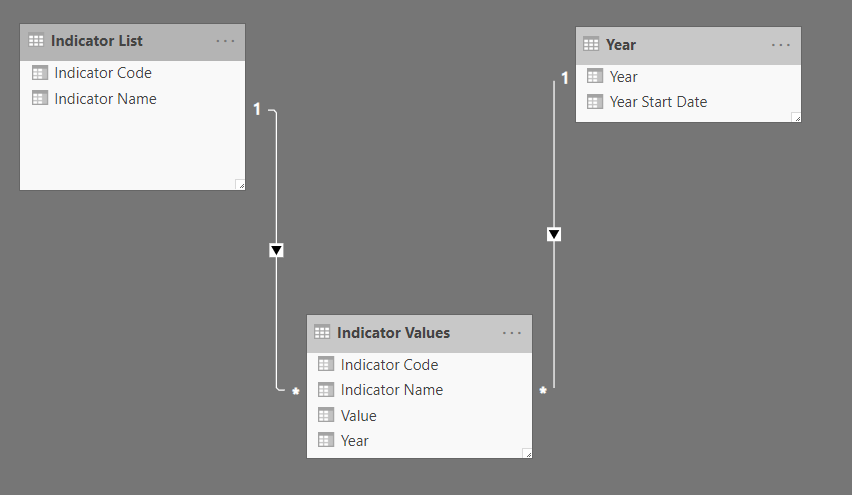
I have a csv file from World bank listing 1000+ different indicators for my country. I would like to group the indicators into different categories example, Health, Education, Employment etc. Each category of indicators will be an independent fact table. Please find below my simple model. The current fact table “Indicator Values” will be split into different fact tables par category
Is there a reason you need separate tables? Based on what you’ve shared, I’d be inclined to have all your indicators listed in the “Indicator List” table with columns for code, name, and category. Then, in your “Indicator Values” table you only need columns for code, year, and value. With the relationship that you’ve already created between the “Indicator Code” columns in both tables, you’re all set.
Based on what i saw, your data have already normalized for the model. you need to add a calculated column which will group the indicators into different categories based on some conditions. Then you all set. In the visualization part you can have a filter on the category level & you can show the indicators grouped on category level. Its not necessary to create separate tables for each category.