Pivot Tables
Pivot tables in Excel are powerful tools for data analysis that allow you to summarize and analyze large amounts of data quickly and easily. Pivot tables allow you to create summary reports from large data sets by grouping, filtering, and sorting data based on different criteria.
Goals
Please follow the directions given below, which include downloading the Excel worksheet required to perform the challenge tasks. Once you have completed the download, proceed to take the challenge and test your skills.
Task
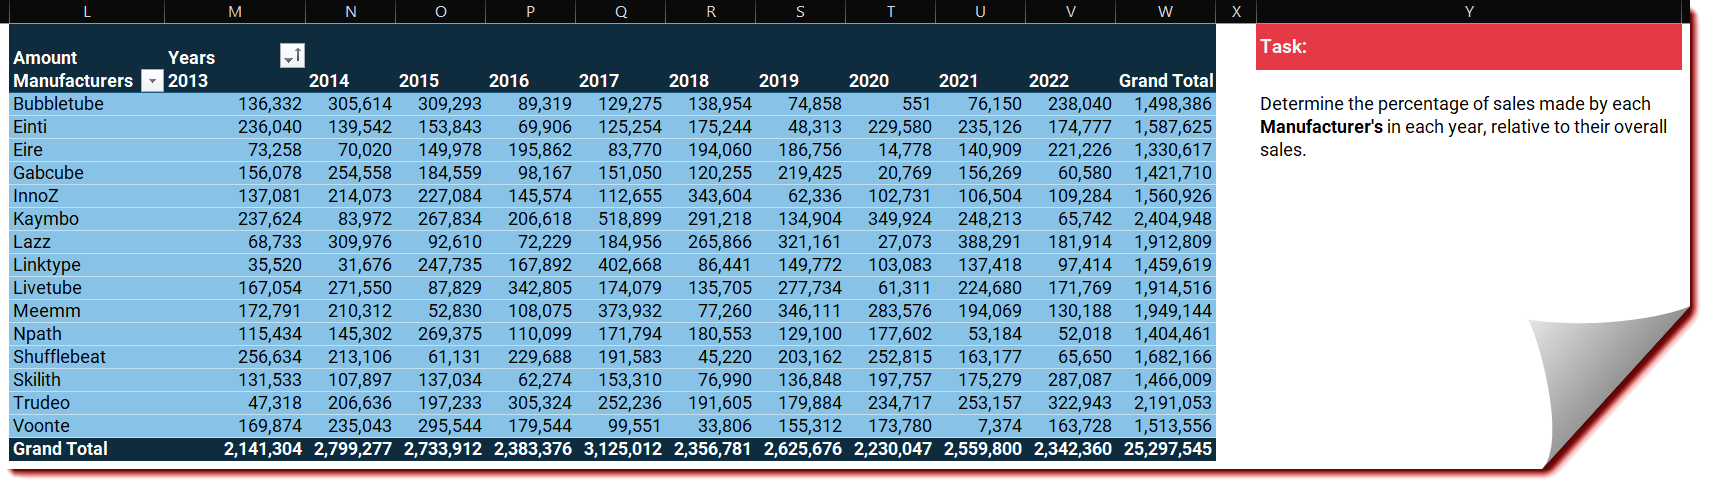
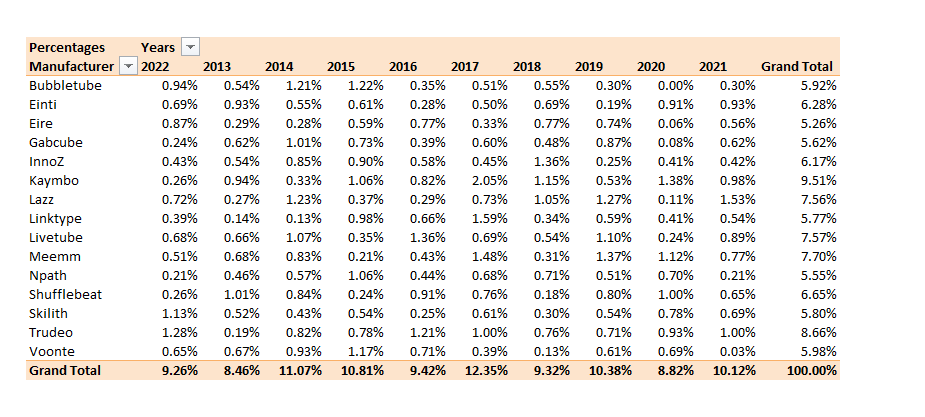
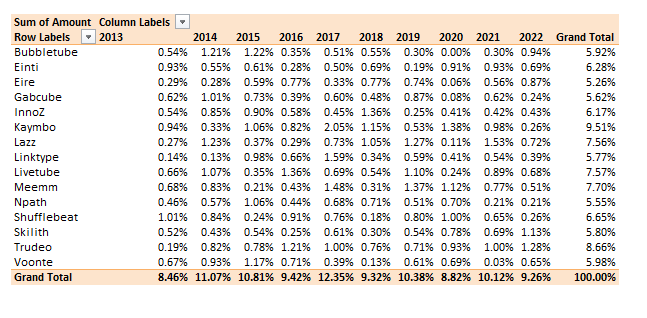
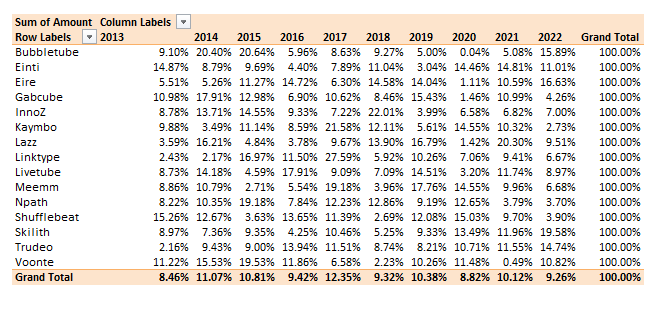
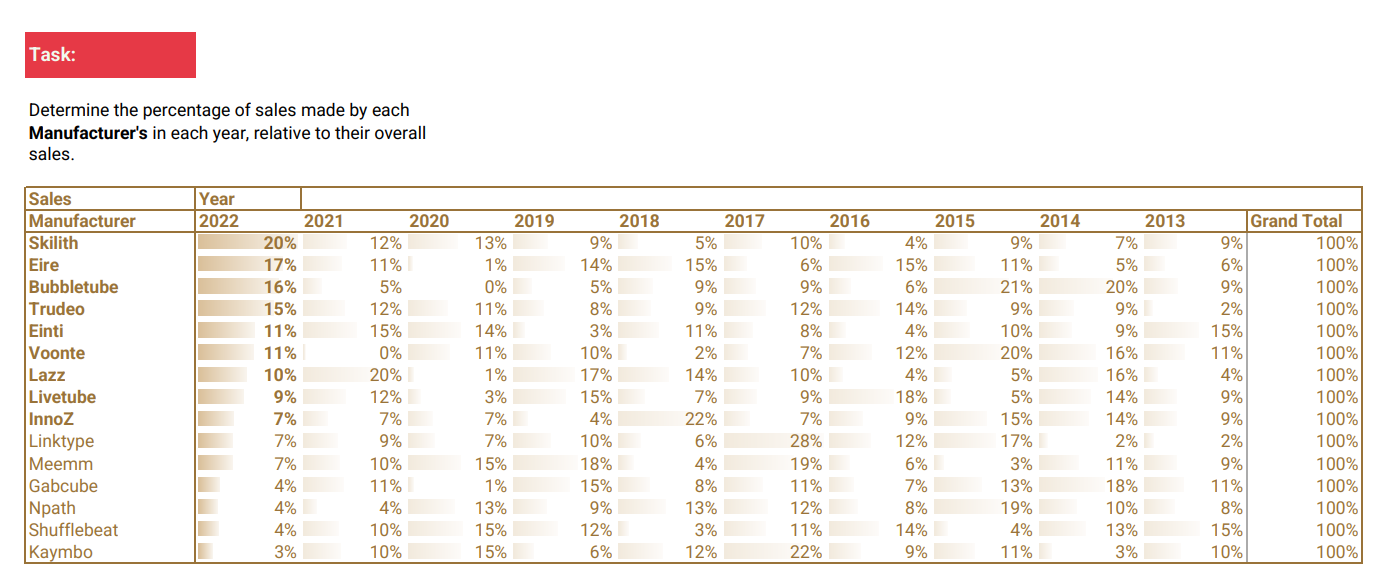
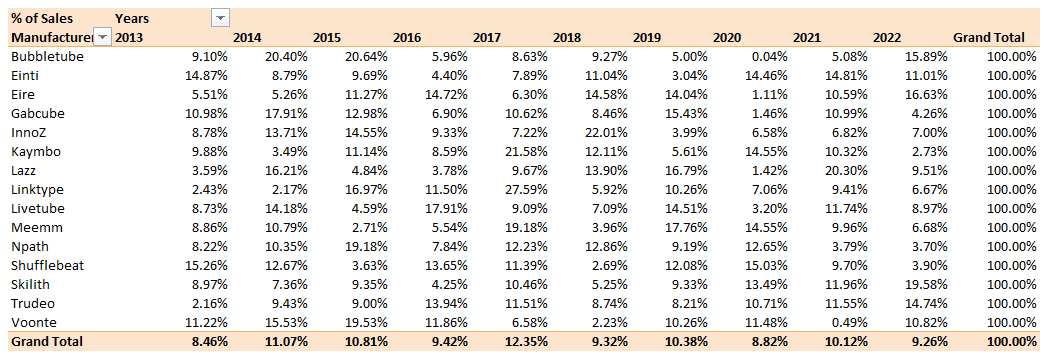
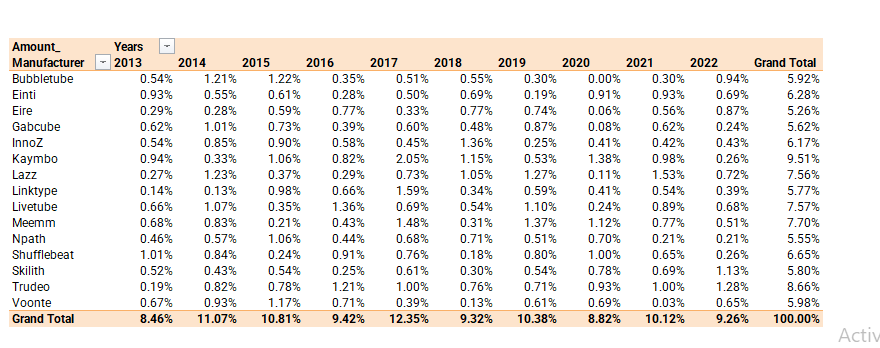
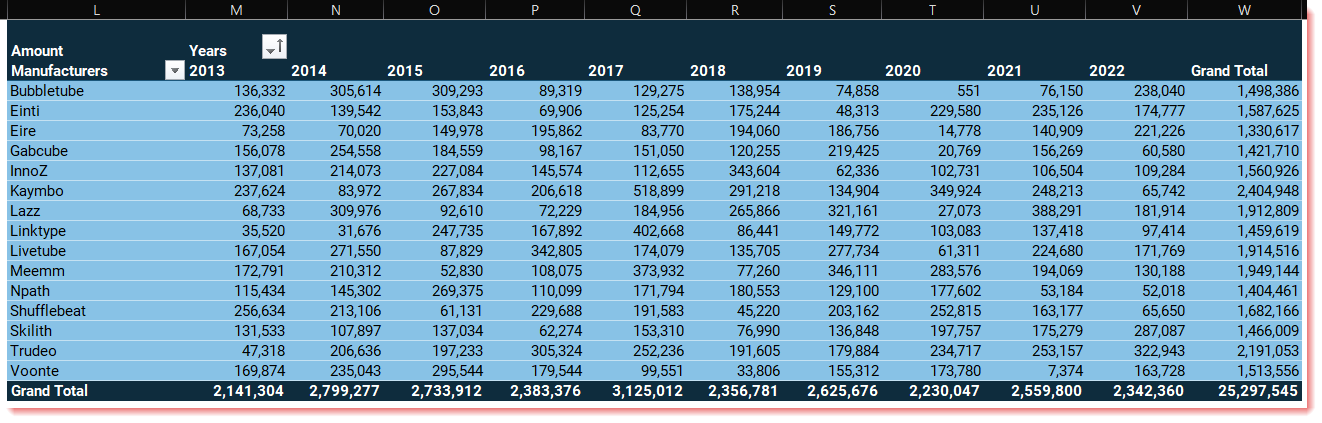
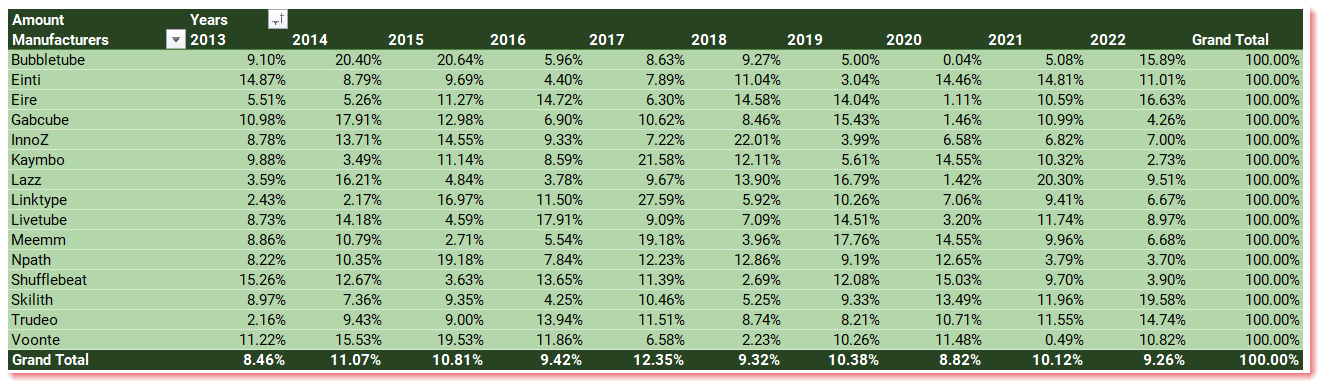
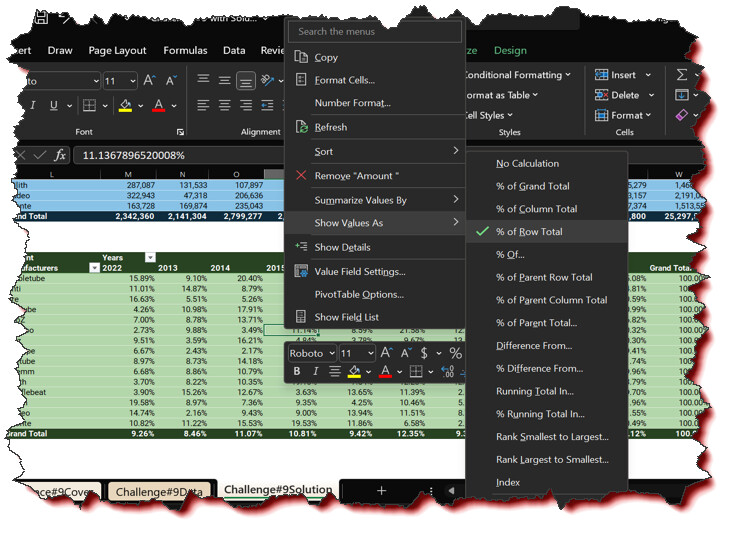
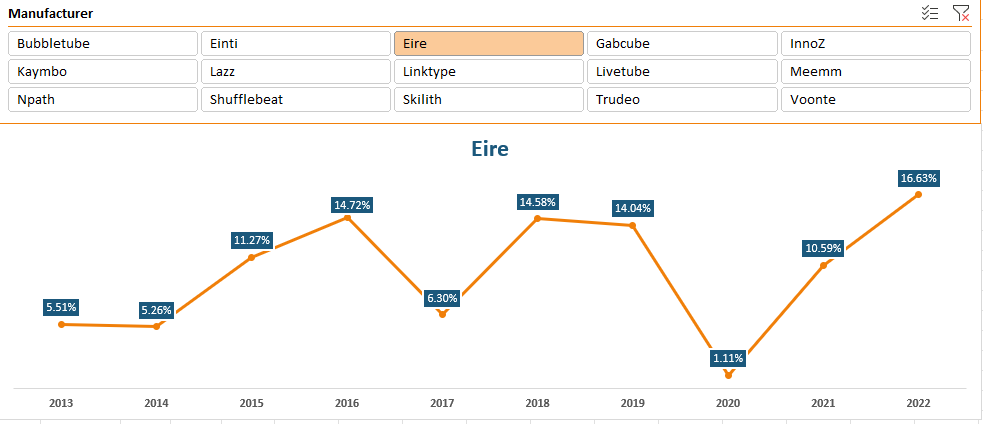
Determine the percentage of sales made by each Manufacturer in each year, relative to their overall sales.
Submission
Reply to this post with your formula code and solution file. Please be sure to blur or hide your formula code.
The word their is a little confusing. Does it mean that we have to compare individual salespersons or total sales?
English is a funny language. Different people interpret it differently. It would be nice if we have the required output as an image. It would help us to get the logic.
Considering the word their in legal language, I would mean Sales of Individual Salesperson w.r.t. their Sales in all years.
I hope and believe that the task - " * Determine the percentage of sales made by each Manufacturer in each year, relative to their overall sales." is very straightforward.
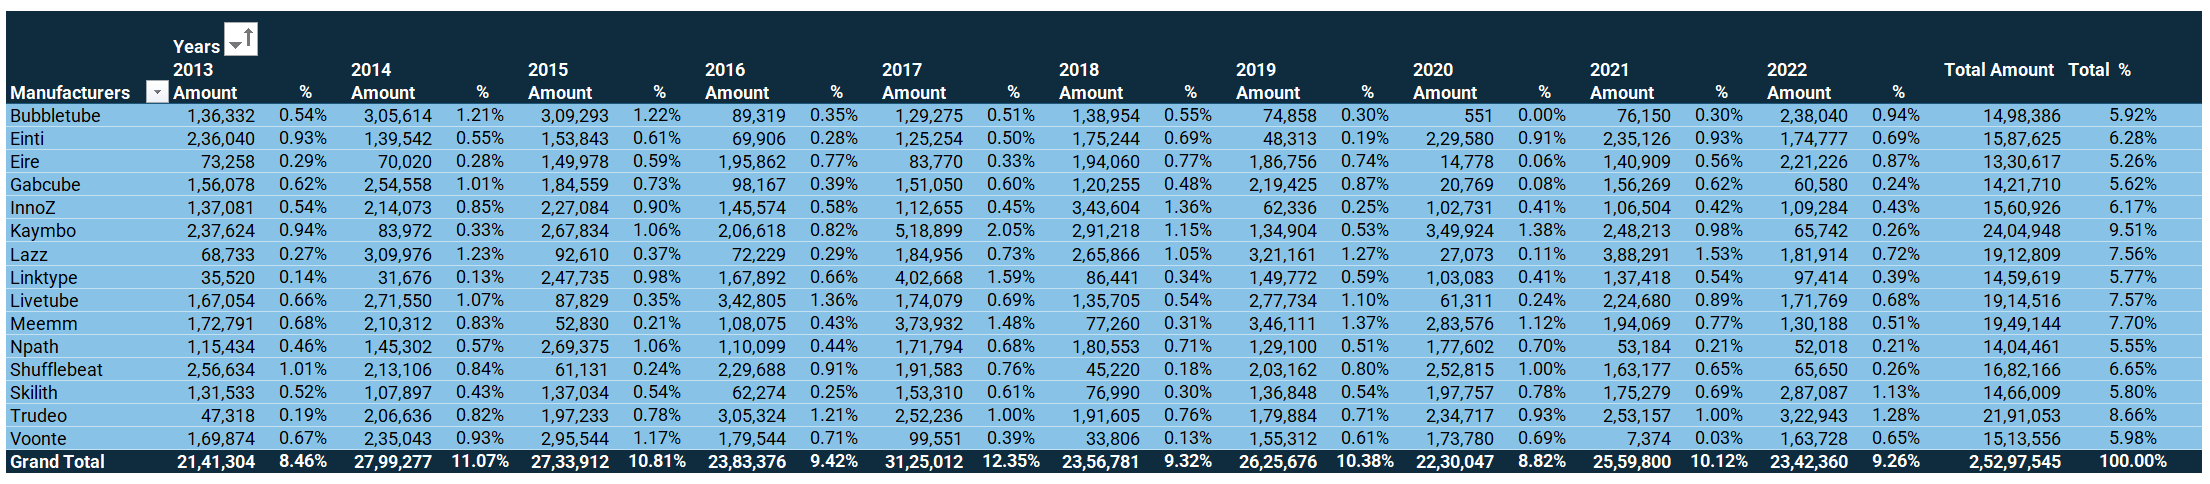
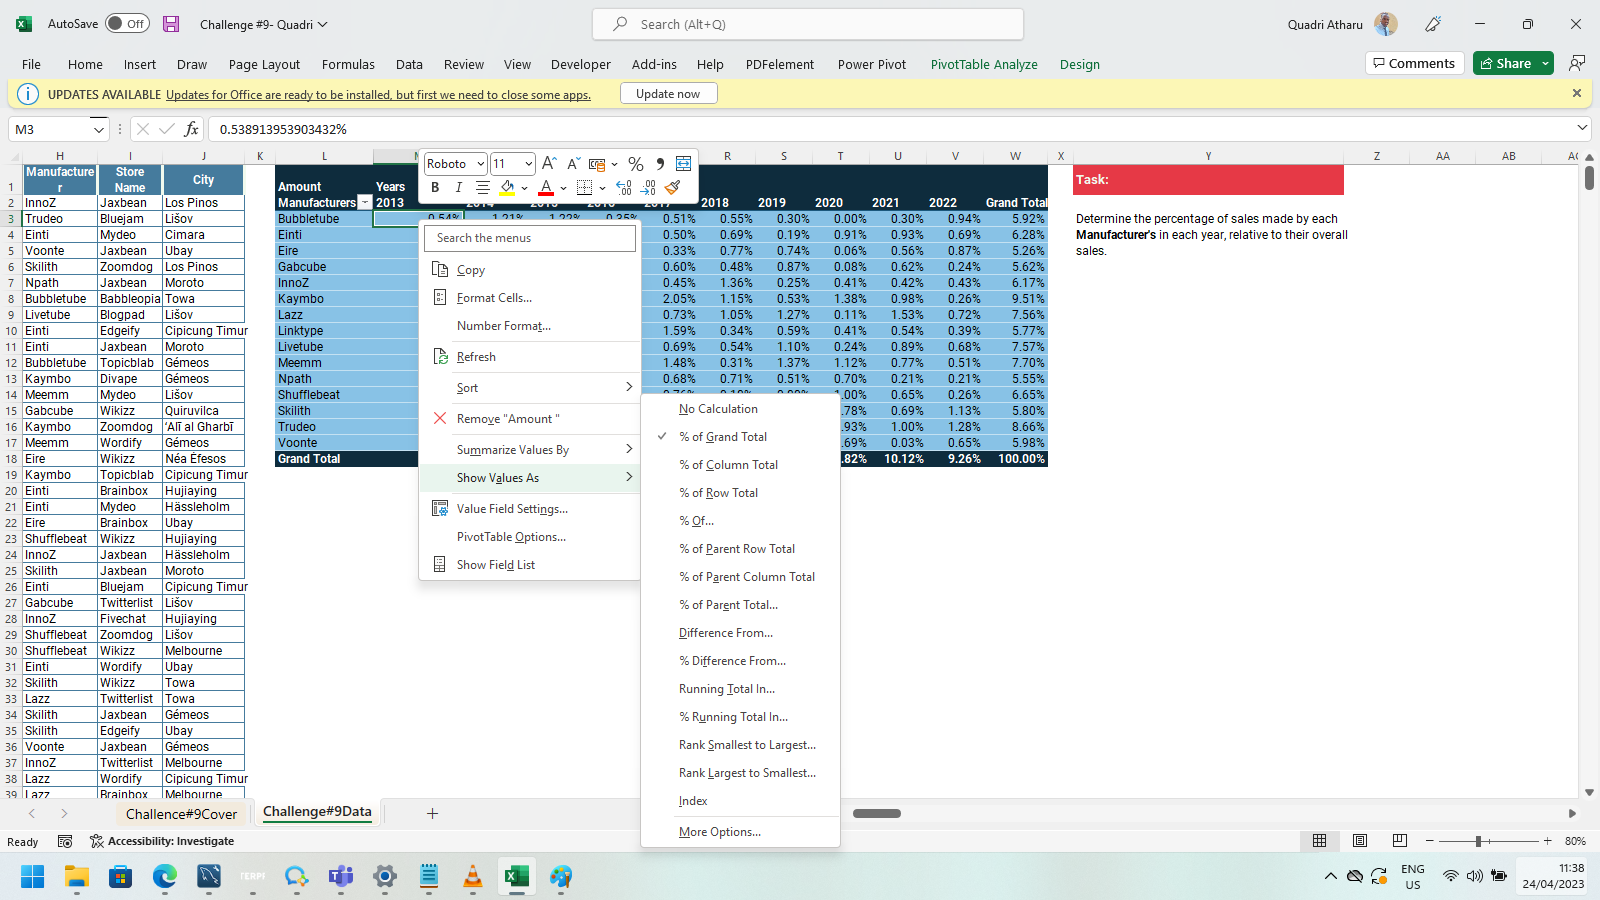
Here is my solution. Although Conditional formatting was not asked, I found it necessary to easily read the data and provide insight, a little effort goes a long way. I also highlighted the most recent year and formatted based on 80/20 rule.
Thank you for participating in the Excel Challenge related to Pivot Tables! I hope you found this challenge to be a fun and engaging way to improve your Excel skills and learn more about how to work with Pivot Table in Excel.