Excel Like report in Power Bi

Hi All,

I am trying to replicate what is currently been used in Excel INTO power bi.

I have excel report, that when the value of the net get populated every month, the rest fields are calculated automatically using formula.

i have done this in power bi but doing it on monthly basic as the dax calculations are fixed.

however, on the excel file, there is a target solution tab. That is what i want to achieve in power bi. Is it possible to do so? or is there a better way to do this.

Test.xlsx (11.3 KB) test2.pbix (59.1 KB)

Hi @alora101,

Welcome back!

Yes you can – don’t know if there is a better way, this requires some work and there are a few quirks…

First I’ve added a Dates table to your model and marked it as a date table.
Then I created a supporting table for all required MatrixLabels, like so:

MatrixLabels =
VAR Months =
    ADDCOLUMNS(
        SELECTCOLUMNS(
            CALCULATETABLE( DISTINCT( Dates[Year+Month] ),
                Dates[YearOffset] =0 ),
            "Year+Month" | [Year+Month]),
        "MonthNo"| LOOKUPVALUE( Dates[MonthNo], Dates[Year+Month], [Year+Month] ) +2
    )
VAR Fields =
    DATATABLE(
        "Year+Month", STRING,
        "MonthNo", INTEGER,
        { 
            { "Gross", 1 },
            { "Net", 2 }
        }
    )
RETURN

UNION( Fields, Months )

Once this table materialized I renamed the columns and sorted the Name column by Index.

Created the missing Gross measure:
TotalGross = SUM( Sheet1[Gross] )
.
And finally the Matrix Value Measure:

Matrix Value = 
SWITCH( 
    VALUES( MatrixLabels[Index] ),
    1, [TotalGross],
    2, [TotalNet],
    3, [Jan],
    4, [FEB],
    5, [Mar],
    6, [Apr],
    7, [May],
    8, [Jun],
    9, [July],
    10, BLANK(),
    11, BLANK(),
    12, BLANK(),
    13, BLANK(),
    14, BLANK()
)

Next I selected the Matrix visual placed the Dates[Year+Month] on the rows, MatrixLabels[Name] on the columns and the [Matrix Value] measure in the Values, with this result:

image
.
Which matches your two separate table visuals:
image

Here’s your file. I hope this is helpful.
eDNA - Excel Like report in PBI.pbix (136.0 KB)

Hi Melisa,

Thanks for your help. Much Appreciated,

What i really need is where you have 8.88 (under 2020Jan) should be under 2020 Feb and 2020Jan should be blank. same thing across the board.

It will calculate from feb to dec
from mar to dec
apri to dec etc.

see screen shot…Thanks for your help.

image

.
I’m afraid you’ve lost me… can you explain it more clearly?

image

From your above screen shot.

the highlighted should be under match and the February value is missing from my own calculation.
same with the rest. How did you get it to this format. I have tried but not getting the desire shape

image

I’m not getting the logic…
But if I understand you correctly you want to move your results by one column to the right? Like so:

image

If so, I’ve updated the Matrix Value measure:

Matrix Value = 
VAR MatrixMonthOffset = LOOKUPVALUE( Dates[MonthOffset], Dates[Year+Month], SELECTEDVALUE( MatrixLabels[Name] ))
VAR DatesMonthOffset = LOOKUPVALUE(  Dates[MonthOffset], Dates[Year+Month], SELECTEDVALUE( Dates[Year+Month] ))
RETURN

SWITCH( 
    VALUES( MatrixLabels[Index] ),
    1, [TotalGross],
    2, [TotalNet],
    3, IF( MatrixMonthOffset = DatesMonthOffset, [Jan], BLANK() ),
    4, IF( MatrixMonthOffset >= DatesMonthOffset, [Jan], BLANK() ),
    5, IF( MatrixMonthOffset >= DatesMonthOffset, [FEB], BLANK() ),
    6, IF( MatrixMonthOffset >= DatesMonthOffset, [Mar], BLANK() ),
    7, IF( MatrixMonthOffset >= DatesMonthOffset, [Apr], BLANK() ),
    8, IF( MatrixMonthOffset >= DatesMonthOffset, [May], BLANK() ),
    9, IF( MatrixMonthOffset >= DatesMonthOffset, [Jun], BLANK() ),
    10, IF( MatrixMonthOffset >= DatesMonthOffset, [July], BLANK() ),
    11, IF( MatrixMonthOffset >= DatesMonthOffset, BLANK(), BLANK() ),
    12, IF( MatrixMonthOffset >= DatesMonthOffset, BLANK(), BLANK() ),
    13, IF( MatrixMonthOffset >= DatesMonthOffset, BLANK(), BLANK() ),
    14, IF( MatrixMonthOffset >= DatesMonthOffset, BLANK(), BLANK() )
)

.
Here’s your file. I hope this is helpful.
eDNA - Excel Like report in PBI.pbix (148.6 KB)

Melissa ,

you are a life saver. Thanks very much

Few things, if i remove any of the measure , it errors out.

Lastly. The January month is blank, it should be filled in,

thanks very much

Yes as you can see I call these measures inside the SWITCH statement.
.

What do you mean? The Jan 2020 combination has a value.

Hi @alora101, we’ve noticed that no response has been received from you since the 7th of March. We just want to check if you still need further help with this post? In case there won’t be any activity on it in the next few days, we’ll be tagging this post as Solved. If you have a follow question or concern related to this topic, please remove the Solution tag first by clicking the three dots beside Reply and then untick the checkbox. Thanks!

Thanks Malissa for all your help.

Much appreciated. i can now close this as problem solved

Hi @Melissa

Sorry to come back to this. I have recreate everything from scratch following what you did exactly but coming out with errors.

even on your attached file, once i remove the measures and try to create the table matrix, i get error

Test.pbix (117.3 KB)

Any help . attached is the file

Thanks

Okay so change the first line inside the SWITCH statement, from:
VALUES( MatrixLabels[Index] )

into
LOOKUPVALUE( MatrixLabels[Index], MatrixLabels[Name], SELECTEDVALUE( MatrixLabels[Name] ))
.
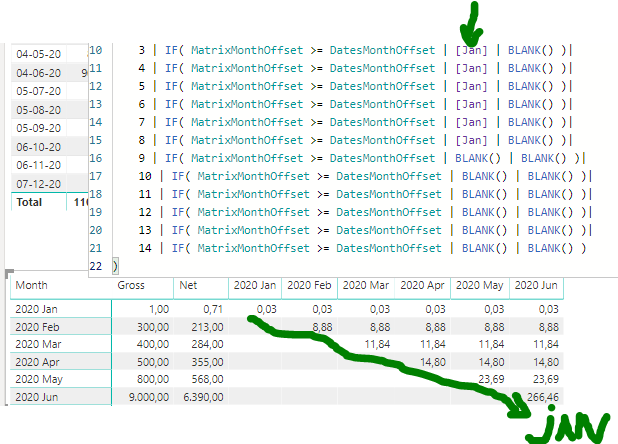
Here’s the fulll Matrix Value measure again:

Matrix Value = 
VAR MatrixMonthOffset = LOOKUPVALUE( Dates[MonthOffset], Dates[Year+Month], SELECTEDVALUE( MatrixLabels[Name]))
VAR DatesMonthOffset = LOOKUPVALUE(  Dates[MonthOffset], Dates[Year+Month], SELECTEDVALUE( Dates[Year+Month] ))
RETURN

SWITCH( 
    LOOKUPVALUE( MatrixLabels[Index], MatrixLabels[Name], SELECTEDVALUE( MatrixLabels[Name] )),
    1, [TotalGross],
    2, [TotalNet],
    3, IF( MatrixMonthOffset = DatesMonthOffset, [Jan], BLANK() ),
    4, IF( MatrixMonthOffset >= DatesMonthOffset, [Jan], BLANK() ),
    5, IF( MatrixMonthOffset >= DatesMonthOffset, [FEB], BLANK() ),
    6, IF( MatrixMonthOffset >= DatesMonthOffset, [Mar], BLANK() ),
    7, IF( MatrixMonthOffset >= DatesMonthOffset, [Apr], BLANK() ),
    8, IF( MatrixMonthOffset >= DatesMonthOffset, [May], BLANK() ),
    9, IF( MatrixMonthOffset >= DatesMonthOffset, [Jun], BLANK() ),
    10, IF( MatrixMonthOffset >= DatesMonthOffset, [July], BLANK() ),
    11, IF( MatrixMonthOffset >= DatesMonthOffset, BLANK(), BLANK() ),
    12, IF( MatrixMonthOffset >= DatesMonthOffset, BLANK(), BLANK() ),
    13, IF( MatrixMonthOffset >= DatesMonthOffset, BLANK(), BLANK() ),
    14, IF( MatrixMonthOffset >= DatesMonthOffset, BLANK(), BLANK() )
)

Thanks very much.

You are a star.

Hi @Melissa

I have just noticed something.

The figures do not match, for example, the first line matches across to December
but on the second line, two figures were missing
for march, three figures
for april, four figures etc.

see screen shot of the excel file and just eye ball it , you will see where i am driving at.

the iteration is skipping values.

hope i did explained well…

Take a look at this. When I change all measure references inside the SWITCH statement to [Jan]
I believe the first diagonal line of values is what you’re after, correct?

image

Then it’ll be a hard one to solve…

Hi @Melissa,

Thanks for your help. This is something that is used across the business heavily. Moving to Power Bi will now be an issue as they invested in this new tool.

I will be coming here often because i got more than 300 reports to do and modelling insurance data.

Once again Thank you but if you find solution, dont forget to reply me