-CAN YOU SOLVE THIS - POWER QUERY CHALLENGE 53-
(Solution in any language also welcome for Power Query Challenges)
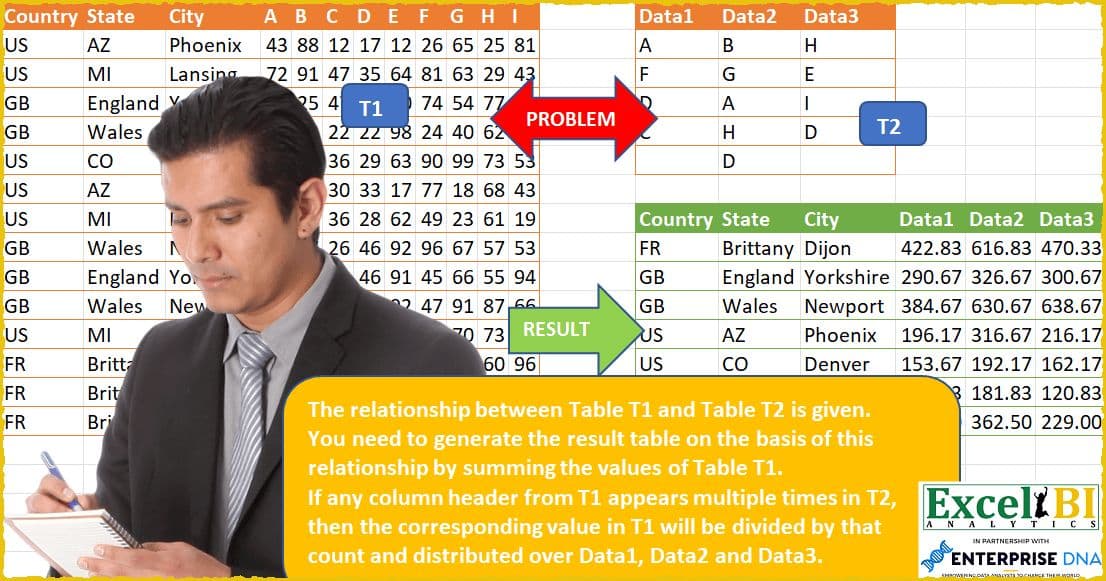
The relationship between Table T1 and Table T2 is given.
You need to generate the result table on the basis of this relationship by summing the values of Table T1.
If any column header from T1 appears multiple times in T2, then the corresponding value in T1 will be divided by that count and distributed over Data1, Data2 and Data3.
For example, D appears 3 times once in each Data1, Data2 and Data3. Hence, the value of column D gets evenly spread over Data1, Data2 and Data3 by dividing column D value by 3.
Similarly, A appears in Data1 and Data2. Hence, value of column A is divided by 2 and evenly spread to Data1 and Data2.
Note here column A doesn’t means Excel’s column A but the header A given in row 1.
Download Practice File - https://lnkd.in/dm2jGRnH
(Post answers in Comment. Your approach need not be different from others as long as you have worked out your approach independently)
#powerquerychallenge, #daxchallenge, #m, #dax, #powerbi, #powerquery, #powerpivot, #sheets, #googlesheets, #data, #analytics, #businessintelligence, #finance, #excel, #excelchallenge, #python, #r
Excel BI’s LinkedIn Post