I am fairly new to the site and so far I love the training videos. However, I do find that the intro videos are fairly basic when it comes to the data that is being utilized (makes sense).
I am new to the PowerBI platform and am enjoying everything that I have learned to this point, but I am wondering what I should focus on as pertains to creating reports for an ERP system such as Epicor.
I have been working with Epicor for a few years but I have been having a difficult time with building the proper relationships with my data for my reports. The One to Many relationships do not seem to work out the way I think they should a lot of the time.
What would you suggest I focus on to ensure that the data I am using has the correct relationships defined? Is there a Lesson Plan that I should focus on?
Thanks in Advance!
Hi @Saugust, I noticed you didn’t provide a PBIX file. Providing one will help users and experts find a solution to your inquiry faster and better.
A perfect initial question includes all of the following:
-
A clear explanation of the problem you are experiencing
-
A mockup of the results you want to achieve
-
Your current work-in-progress PBIX file
-
Your underlying data file (to allow us to go into Power Query if necessary to transform your data and/or data model – often DAX questions really end up being data modeling solutions)
Check out this thread on Tools and Techniques for Providing PBIX Files with Your Forum Questions
Not completing your data may sometimes cause delay in getting an answer.
Hello @Saugust ;
I am not familiar with Epicore but I worked with Dynamics NAV and Cenium PMS.
I believe you have a Database that you are connecting to. Of course best case scenario will be to have a Data Warehouse but is possible to do some tricks just in Power BI.
You might know these procedures but I take the liberty to explain in case some other members might need.
As @EnterpriseDNA mentioned, it is imperative for support to “see” the case but I believe that you have some sensitive information that you do not want to share. If that is the case, you might want to do the following:
CASE 1 - Export ALL your tables to an excel spreadsheet, a bit time consuming but at least you could change names, figures etc.
1.1. Connect your pbix to the excel document;
1.2. Upload both of the files here so the members can see the case;
CASE 2 - DIY approach
What I suggest is to have a good representation of the Tables in your schema, create some Dimension Tables and Fact Tables directly within Power BI in case you do not have a DataWarehouse. Create a Date Table Lookup on forum the one from @Melissa is really good. (Might check up this link Creating a dynamic Start-/EndDate for the Date table)
Make sure you always keep on your tables the Primary keys.
In order to achieve that, I recommend using Microsoft SQL Server Management Studio. I will only explain for one table here.
2.1. Lookup the table that you want to import. Use the “Script Table as” → SELECT TO → New query
You might have a bunch of columns that you are never going to use but are useful in the ERP.
2.2 Reduce the query to those Columns that YOU NEED including the Primary Key/ID.
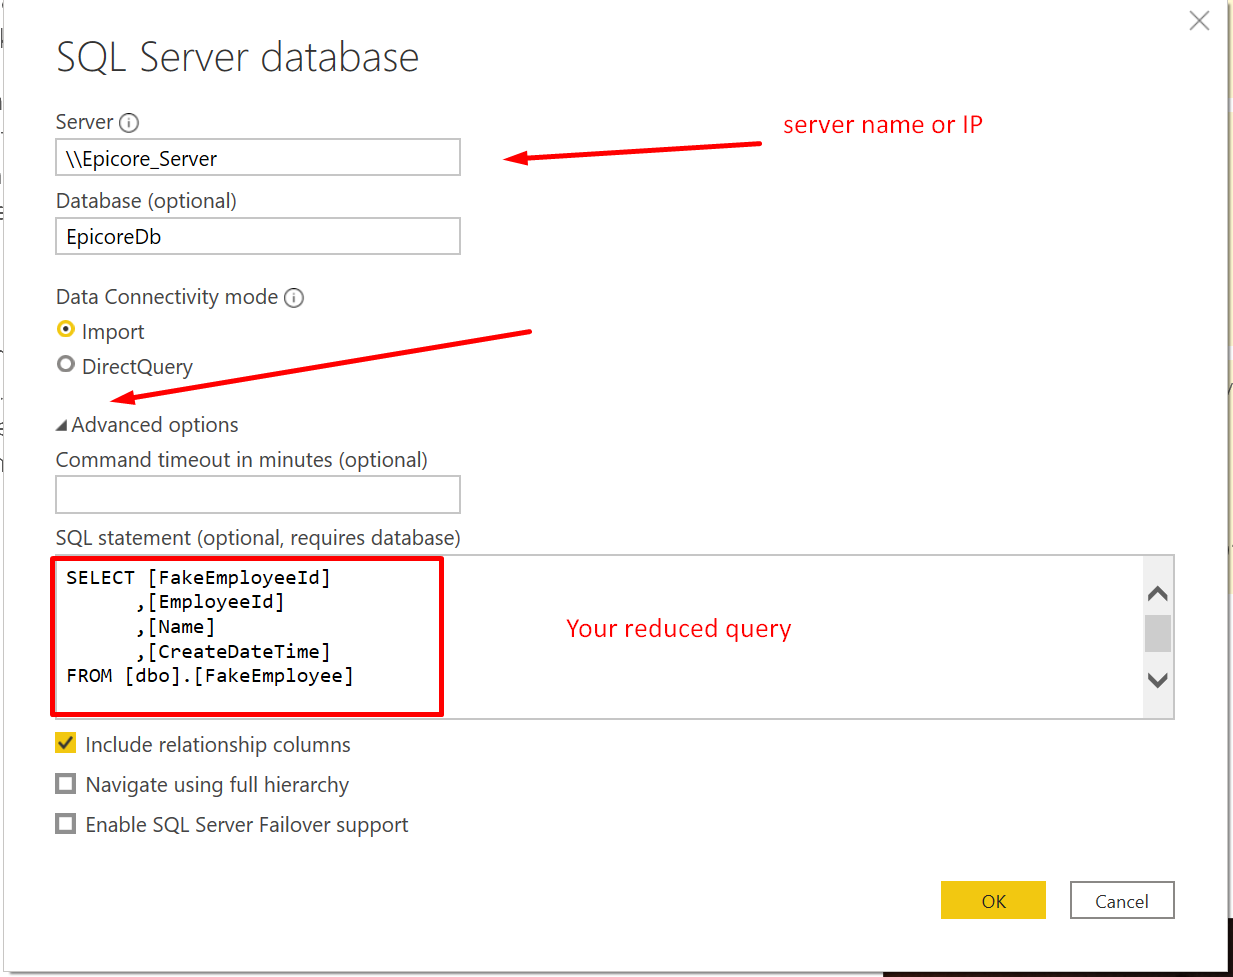
2.3. Open Power BI Desktop and in the Get Data choose SQL Server
. Open Advanced Options
2.4 Do the same for the rest of the tables you need.
2.5. Clear up your DataModel
2.6 Use Power Query to Merge , Add columns (indexes are very imortant for tables that do not have Primary keys or Columns that can hook up with other tables.) or other transformations that your data model needs.
Once you get there, ask for more:-)
Well, I know this is not much help for now, but as a Painter cannot paint blindfolded or a Sound Engineer cannot mix without Monitor speakers, the analyst cannot work without data so this is just something to get you started again.
Cheers!
1 Like
Actually this was very helpful. As I said, I am new to this and your answer opened my eyes to some possibilities I had not considered prior. The reports I have written to this point have all been created by pulling down the entire contents of each table and then working with the Power Query Editor to get down to only the columns that I really needed. The example of the reduced query that you attached is something I will be testing. My reports are working as I had hoped, but it took some time to get there.
I was not looking for a specific answer to a question, more just a question of how SQL/ERP systems are approached. Thank you for the input.
Hello Scott ( @Saugust ),
Glad there is something you could use.
OK, if that is a general discussion, then there are API’s as well to connect to the database and they work great! It all depends on your environment, where is/are the database/s and how many sources you are connecting to, user rights and WHO is going to have access to your report.
Should you have other questions, please do not hesitate to post them on the Forum. We are family:-)
best regards,
Sorin
1 Like
Hi @Saugust, did the response provided by @sorinlinx help you solve your query? If not, how far did you get and what kind of help you need further? If yes, kindly mark as solution the answer that solved your query.
I hope that you are having a great experience using the Support Forum so far. Kindly take time to answer the Enterprise DNA Forum User Experience Survey, we hope you’ll give your insights on how we can further improve the Support forum. Thanks!
Hi @Saugust, we’ve noticed that no response has been received from you since July 22. We just want to check if you still need further help with this post? In case there won’t be any activity on it in the next few days, we’ll be tagging this post as Solved.
I was looking for some direction and this gave me some ideas. What I ended up doing for this particular report was to schedule the Business Activity Query (BAQ) from Epicor to export to an .xml file and then use that file to create the Power BI Report.
The reason I did this was so that I could simplify the reporting process. Instead of recreating a dataset by importing all of the necessary tables and columns directly from the SQL DB, I instead just used the BAQ report that has been used to this point.
The current method for users was to run the BAQ, Export to Excel, modify and sort the information to their specifications, then create Pivot tables in order to see the data they way they wanted. This was a manual process that was performed several times per month.
Now, it is as simple as opening the report and clicking refresh. I present the results on Friday.
I will also (for testing purposes) be creating the same report with a SQL dataset. The challenge is getting the relationships correct. In this way, I can compare the data in both reports to verify whether or not my relationships are created correctly.
Thanks for the help.