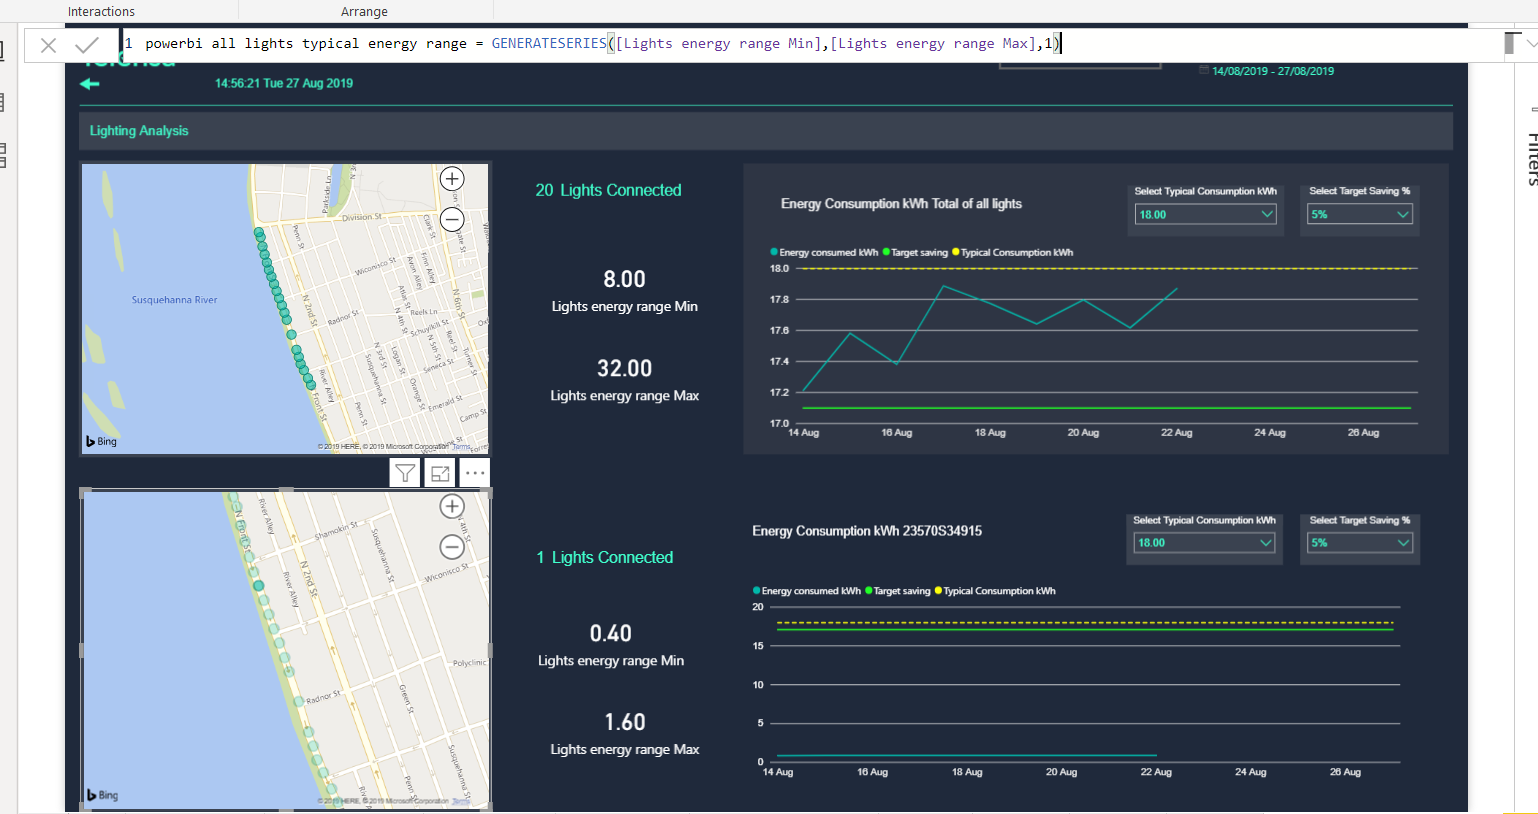
I have report showing the energy in kWh used on streetlights. It includes a Bing map showing 20 lights. There is a graph showing the sum of kWh for all the lights the graph includes two “selected metrics” so you can compare actual energy used against a typical consumption kWH and a target saving.
The range of values in the typical consumption slicer should be dynamic by using the number of lights connected along with a MIN and MAX to give an appropriate range…
Lights energy range Min = ‘Key Measures Lighting’[Lights Connected] * 0.8 * 0.5
Lights energy range Max = ‘Key Measures Lighting’[Lights Connected] * 0.8 * 2
I then put these measures into the DAX to create a table ;
PowerBI all lights typical energy range = GENERATESERIES([Lights energy range Min],[Lights energy range Max],1) (so that as new lights get connected the slicer range grows accordingly)
This all seemed to work OK. Although I am not sure if the table will update in the future.
My employer wants the line graph and the slicer to interact with the map if one light only is selected.
I had hoped that as my typical energy range is based on measures the values would recalculate somehow but the original series remains unchanged.
Is there a way of having one slicer that changes its range upon selections?
Attached is a snip showing what happens to the line graph when one light is selected, thanks
Hello Paul - hopefully I can successfully add the google drive link for you to see the pbix file as the file is too big to upload, thanks for looking at this for me.
What do you mean by “Is there a way of having one slicer that changes its range upon selections”
the scale of the Y axis?
One light selected only reflects a minimal bandwidth change, hence the line looks straight.
A few remarks:
The model is hard to debug, because you have changed many column names in measures and for measures.
Use of SUMX to sum is not required
PL Energy consumed kWh = SUM('smartcity lighting'[energy_kwh])
is ok, use “X” functions only when you have to iterate.
Mark your datetable as “datetable”, your data holds many date columns and by default PBI will create multiple date tables automatically, this impacts model size.
Thanks for looking at this for me - apologies for structure of my model, I am just an enthusiastic amateur and I appreciate the tip on mark as a date table - that is fixed.
In respect of the lighting report - I am happy with how the Energy Consumed line is working but I wondering if there is a way of changing the typical consumption range. So, when no selection is made the range is from 8 to 32 but when a selection is made the range and the default setting changes to zero to 5. I created a table that would dynamically set the range because more and more lights are expected to be add over time;
powerbi all lights typical energy range = GENERATESERIES([Lights energy range Min],[Lights energy range Max],1)
But as the “all lights” range increases the “selected light” graph becomes more flat and useless.
Is there a way in DAX to switch between two different “ranges” depending on whether a light is selected or not?
there has been a recent post about “How to use a measure as a slicer”. Usually a slicer comes from a column. You can create tables in Power Query as well from your data, your generate function could be replaced with a query that will refresh, anything you calculate in PQ usually is faster and better for the model. I noticed many time columns in your data, in the PQ editor you can do many calculations with times and dates
Thanks to the contributors of this post. Due to the length by which this post has been active, we are tagging it as Solved. For further questions related to this post, please make a new thread.
 and I appreciate the tip on mark as a date table - that is fixed.